
If Hastings Looked in the Mirror, Who Would Look Back?
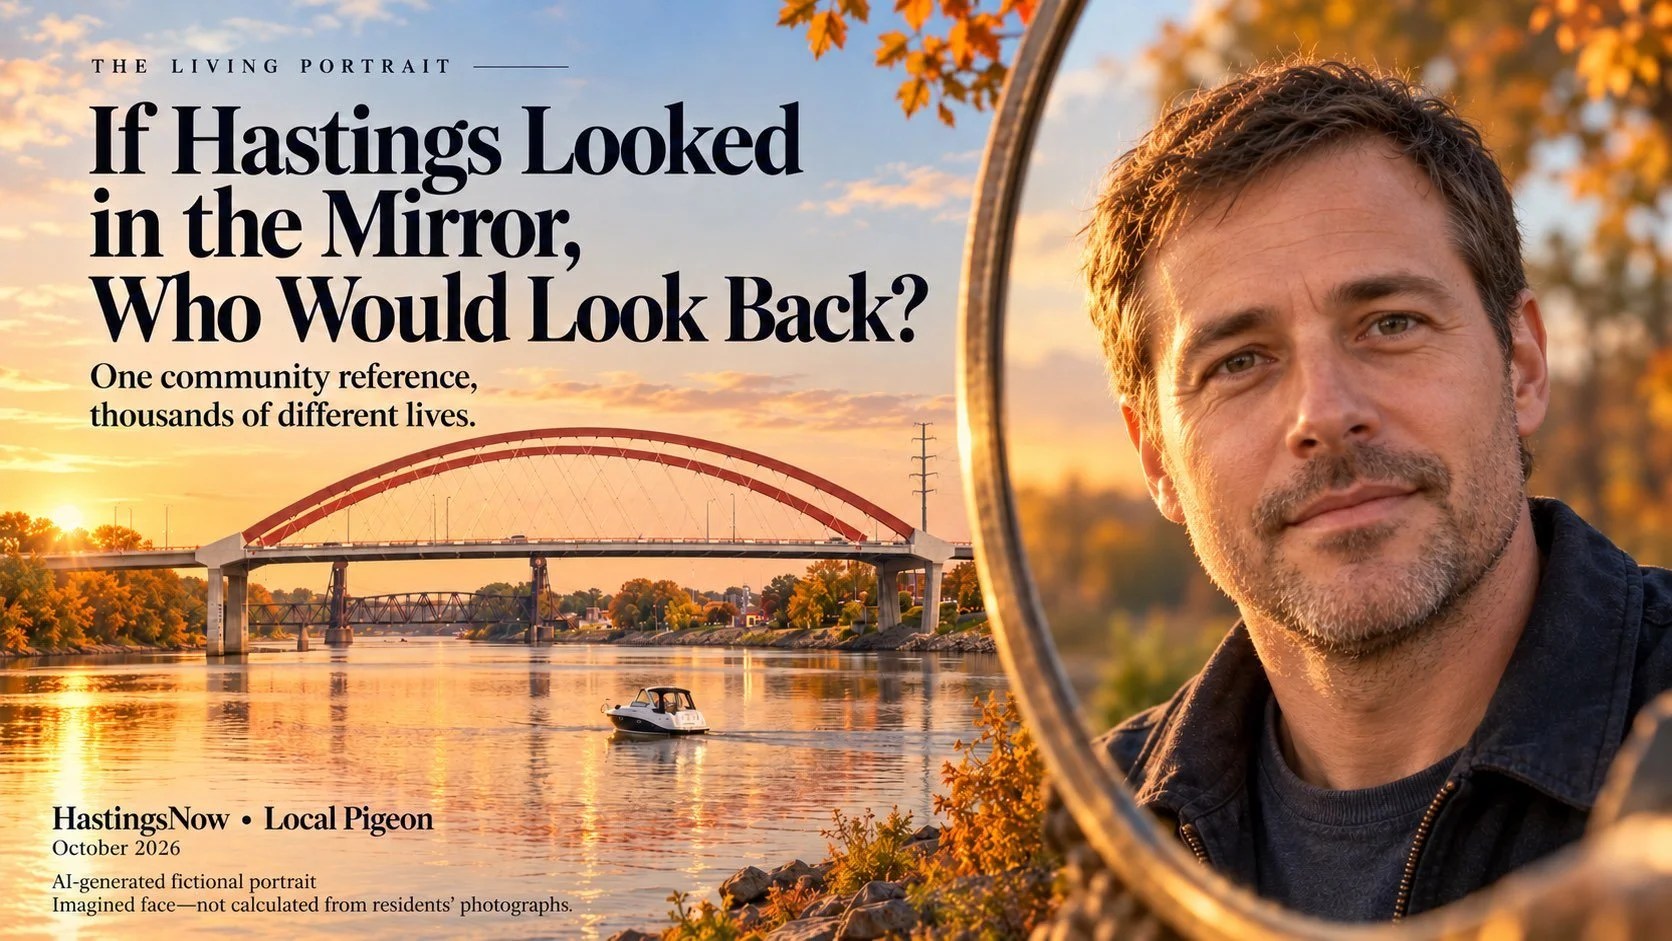
AI-generated editorial illustration of a fictional community reference. It depicts neither a real resident nor a statistically averaged face. Its appearance is an artistic choice; the five defining traits come from separate population summaries.
One community reference, thousands of different lives.
The Living Portrait | HastingsNow + Local Pigeon | October 2026
Imagine a mirror large enough to hold Hastings.
Bring everyone into the picture: children and grandparents, renters and homeowners, people whose families have been here for generations and people still learning their way around. Include the neighbors whose names we know and the people whose lives rarely become public stories.
Now ask that mirror for a single figure.
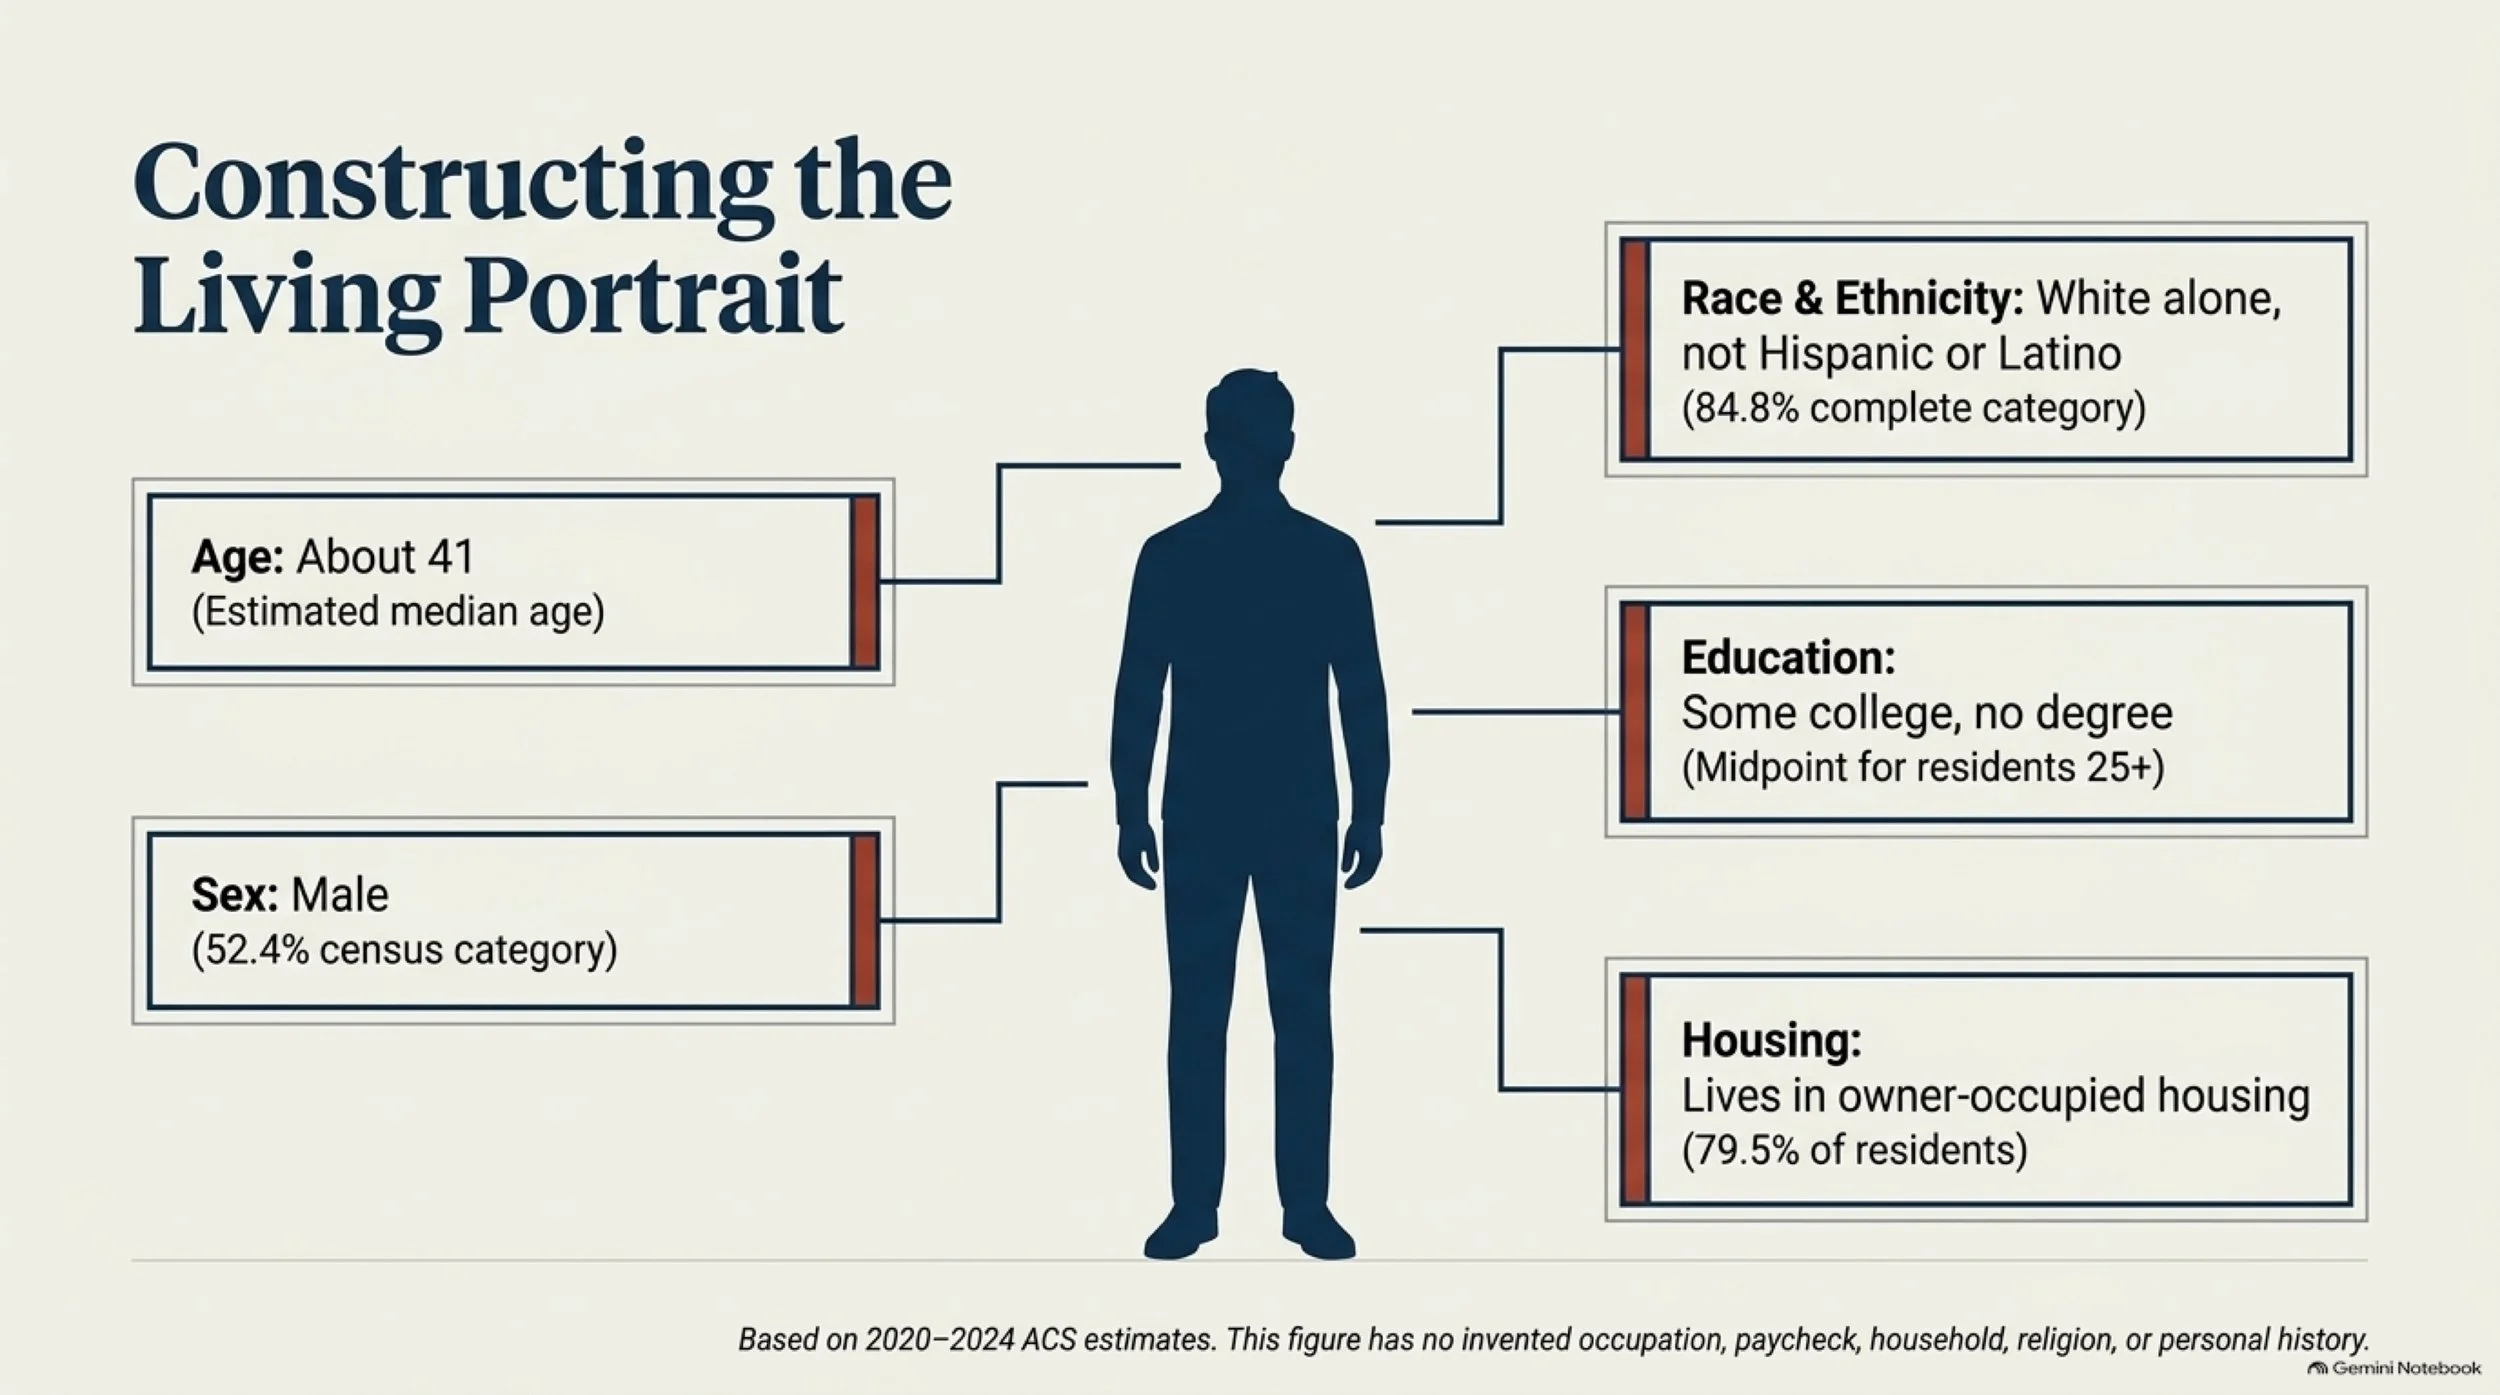
For this first Living Portrait, our fictional reference is about 41. We assign it the Census categories male and White alone, not Hispanic or Latino. Its education reference is some college of at least one year without a degree. It lives in owner-occupied housing.
That description comes from separately selected community statistics. It is a construction, with deliberate limits. We have not discovered the person who best embodies Hastings, or established how many residents share all five traits.
The point is to give us something common to look at—and something useful to question.
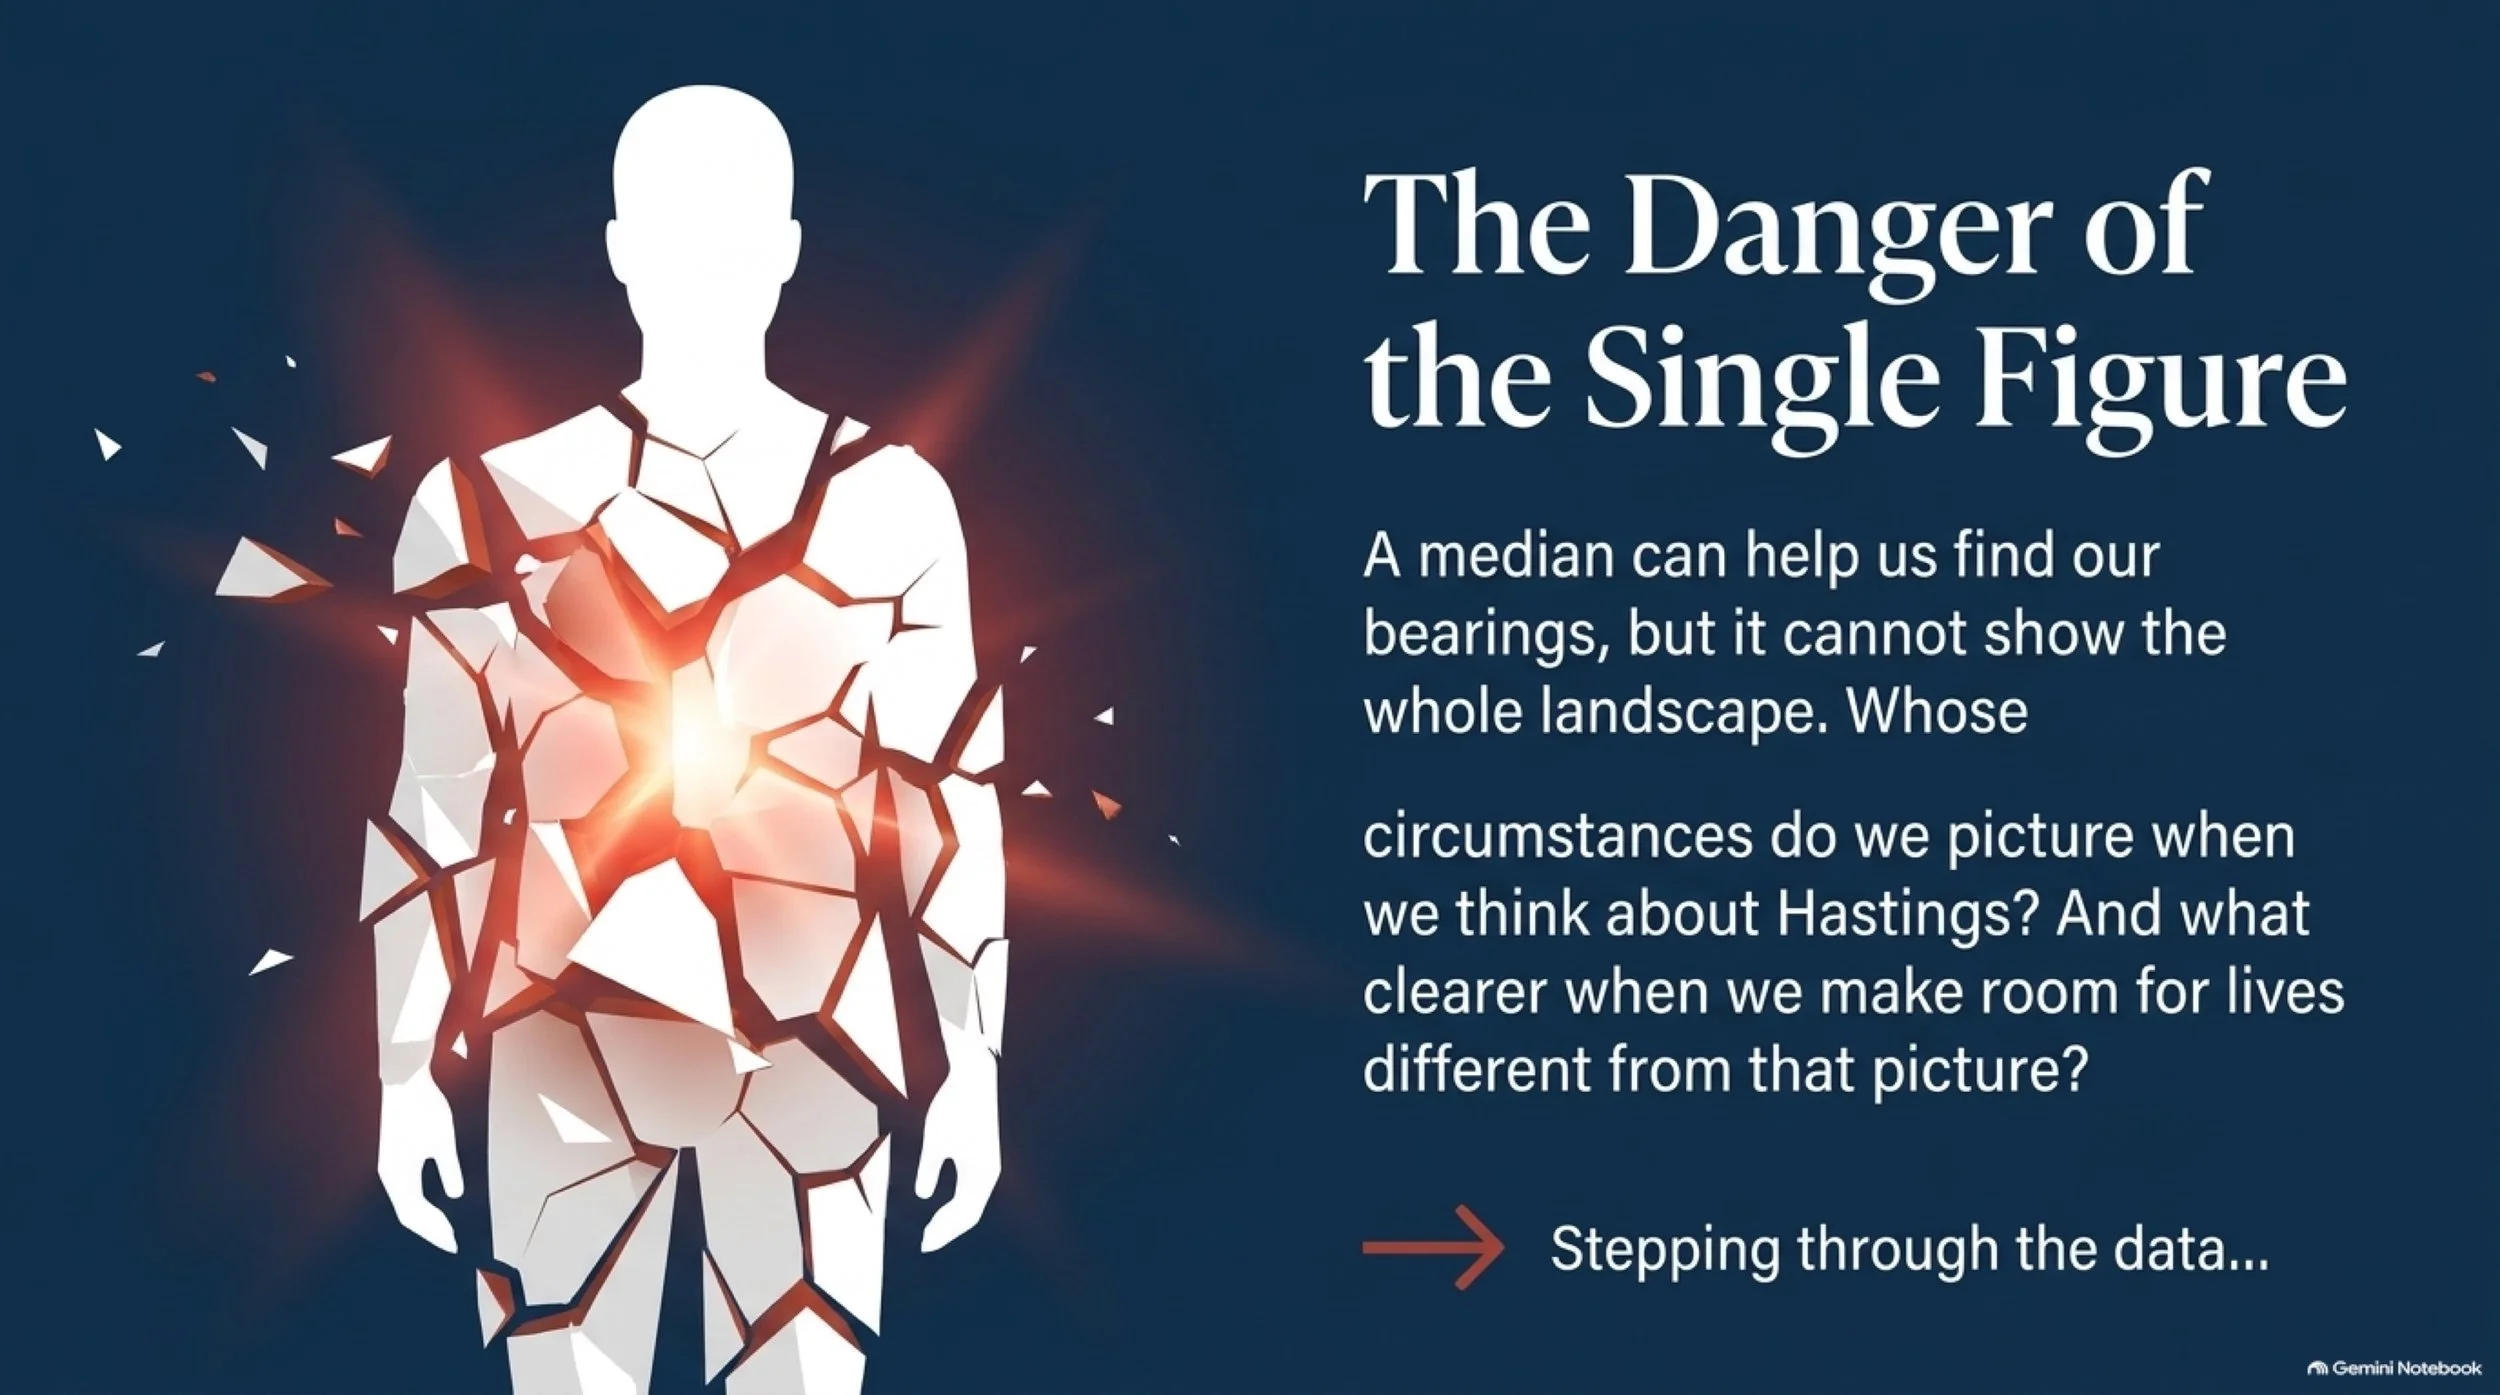
Whose circumstances do we picture when we think about Hastings? What becomes clearer when we make room for lives different from that picture?
One reference, five carefully chosen traits
This is one fictional reference assembled from separate community statistics. The data do not establish a typical person with all five characteristics.
Trait | This edition’s reference | What the evidence means
Age
About 41
The estimated median age of all residents, with a published 90% margin of error of ±1.4 years.
Census sex category
Male
An estimated 52.4% of residents fall in this category: a modest majority, not a measure of gender identity.
Census race and ethnicity category
White alone, not Hispanic or Latino
An estimated 84.8% of residents fall in this complete category. It does not specify a face or personal beliefs.
Education
Some college, one or more years, no degree
The estimated category containing the education midpoint among residents 25 and older. It does not describe most residents.
Housing situation
Lives in owner-occupied housing
An estimated 79.5% of all residents live in such homes. They do not all personally own them.
Sources: Census Bureau, 2020–2024 American Community Survey: median age, age and sex, race and Hispanic origin, educational attainment, and residents by housing tenure. These describe a five-year period, not a live October 2026 count.
The categories need care. The city’s median age is not the median age of men sharing the other selected traits. The education measure excludes people under 25. And selecting the largest race-and-ethnicity category does not make anyone outside it less fully part of Hastings.
The illustration adds artistic choices—a face, hair, clothing, an expression. Those details were not measured by the Census. The figure has no invented occupation, paycheck, household, religion, political affiliation or personal history.
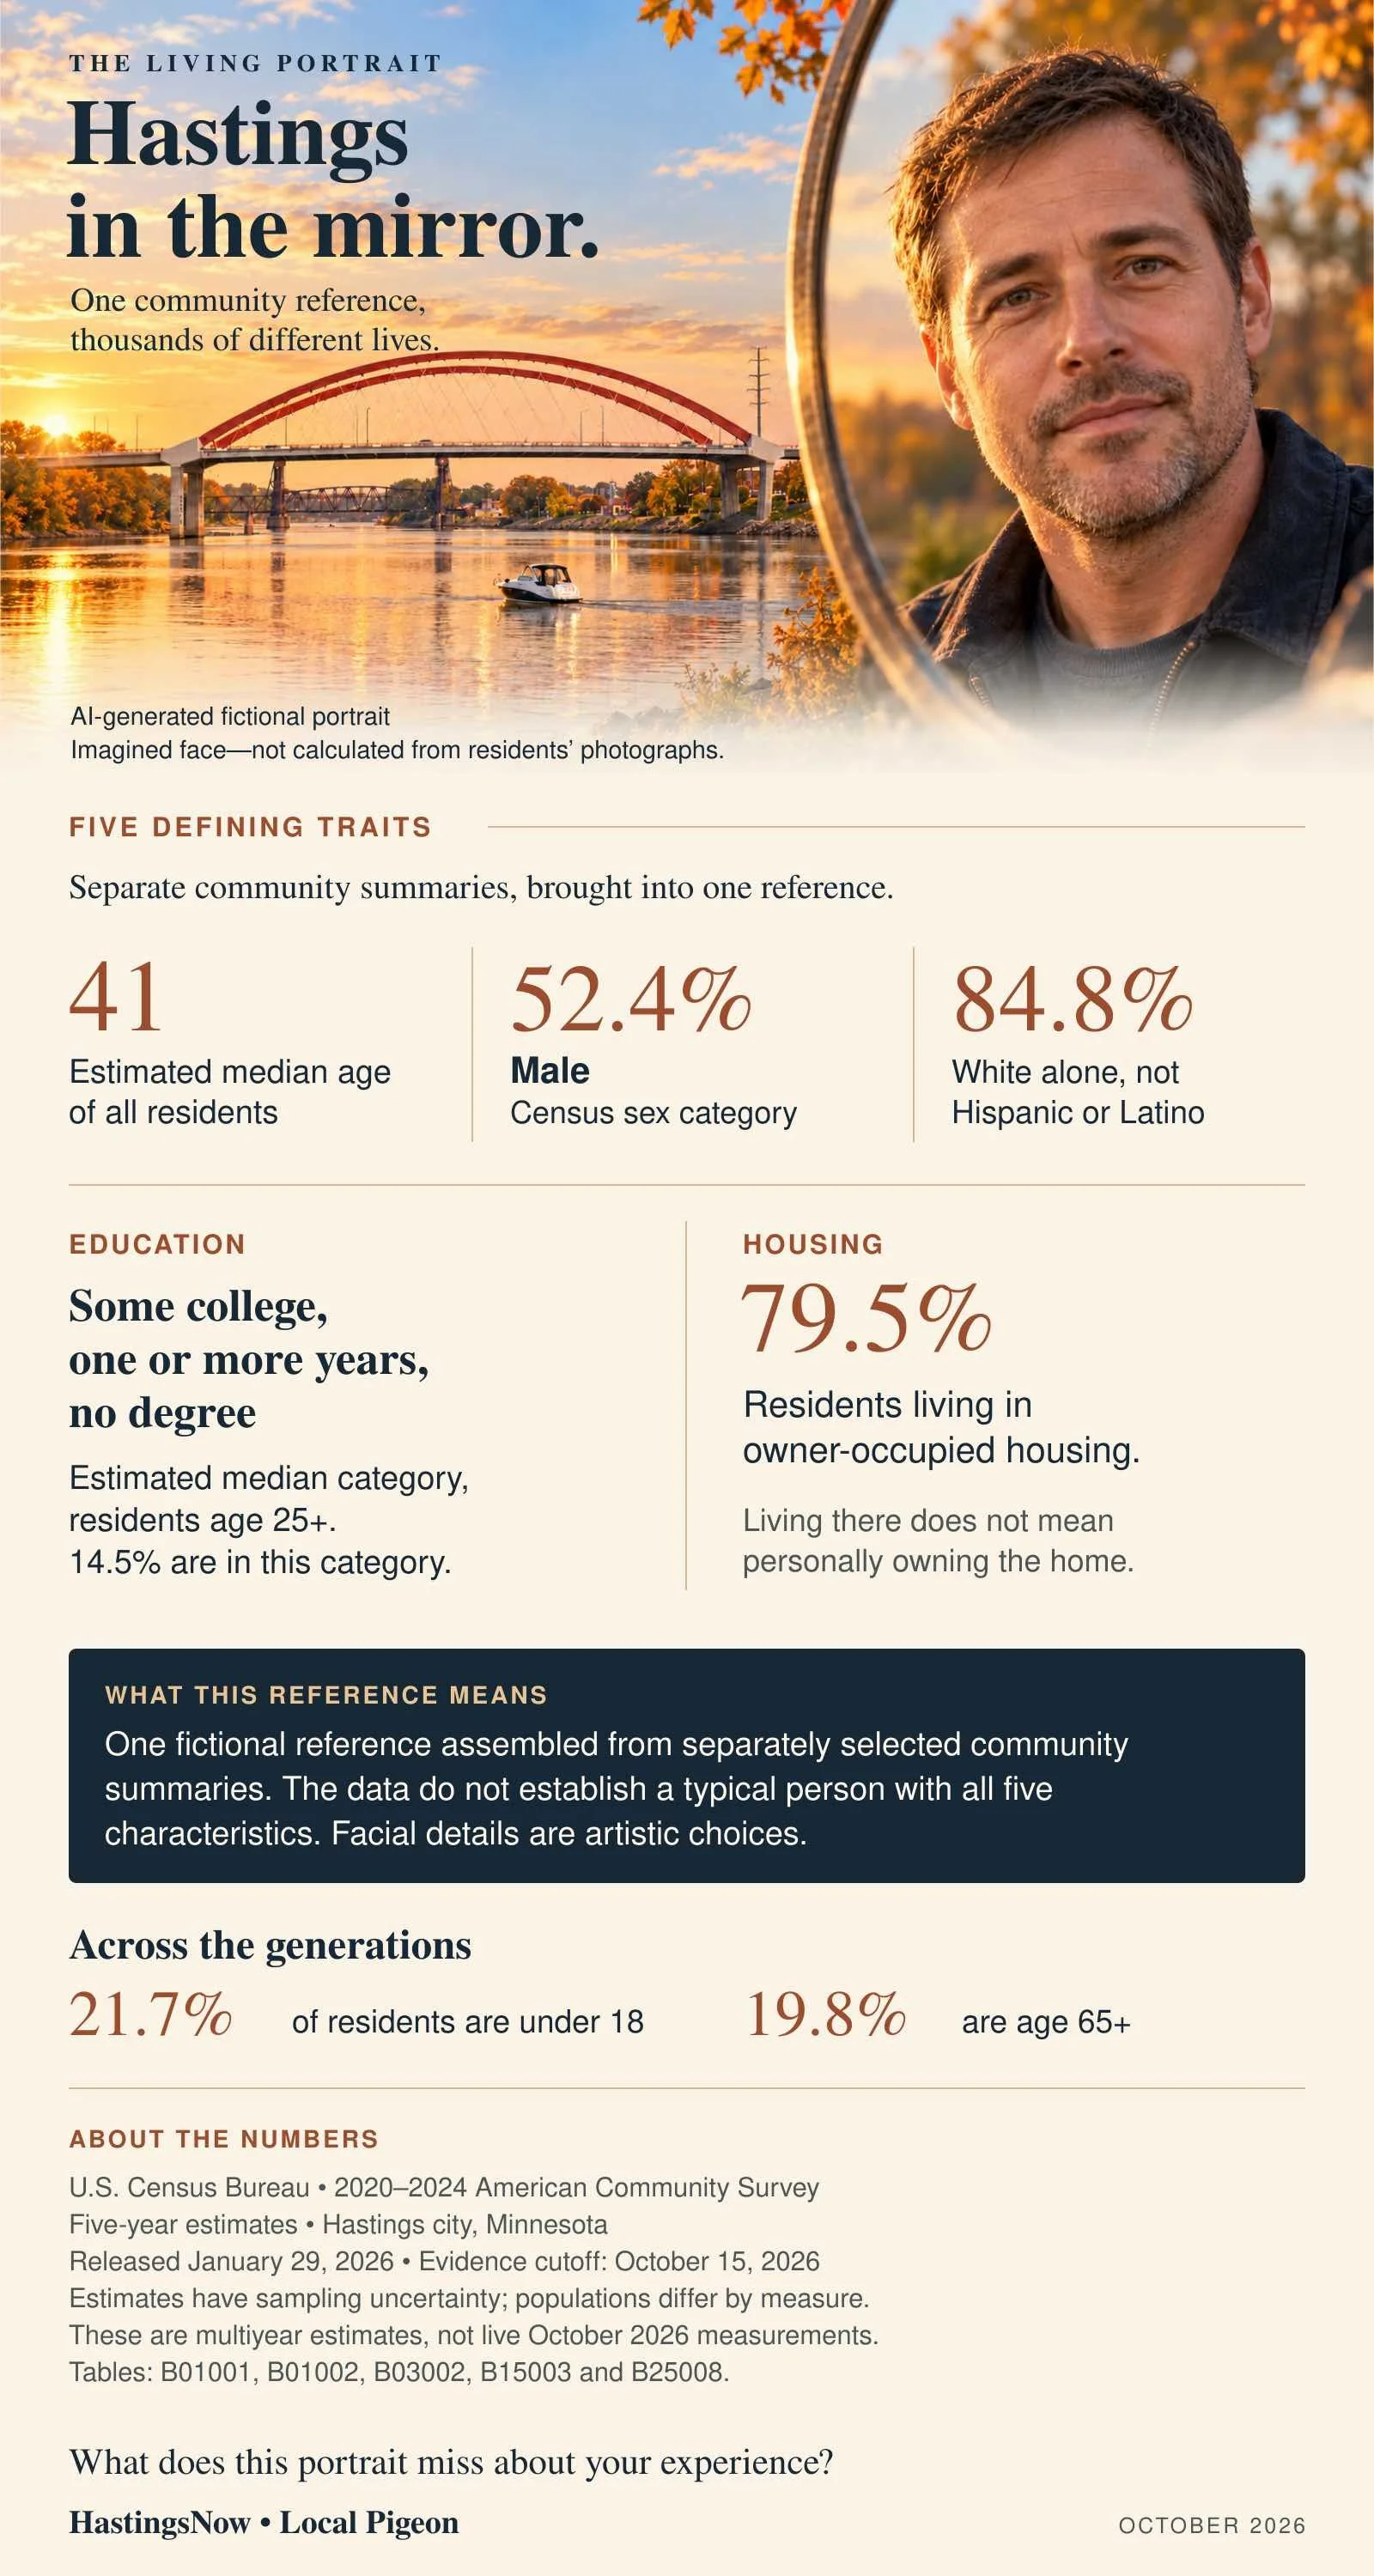
Infographic by HastingsNow.com
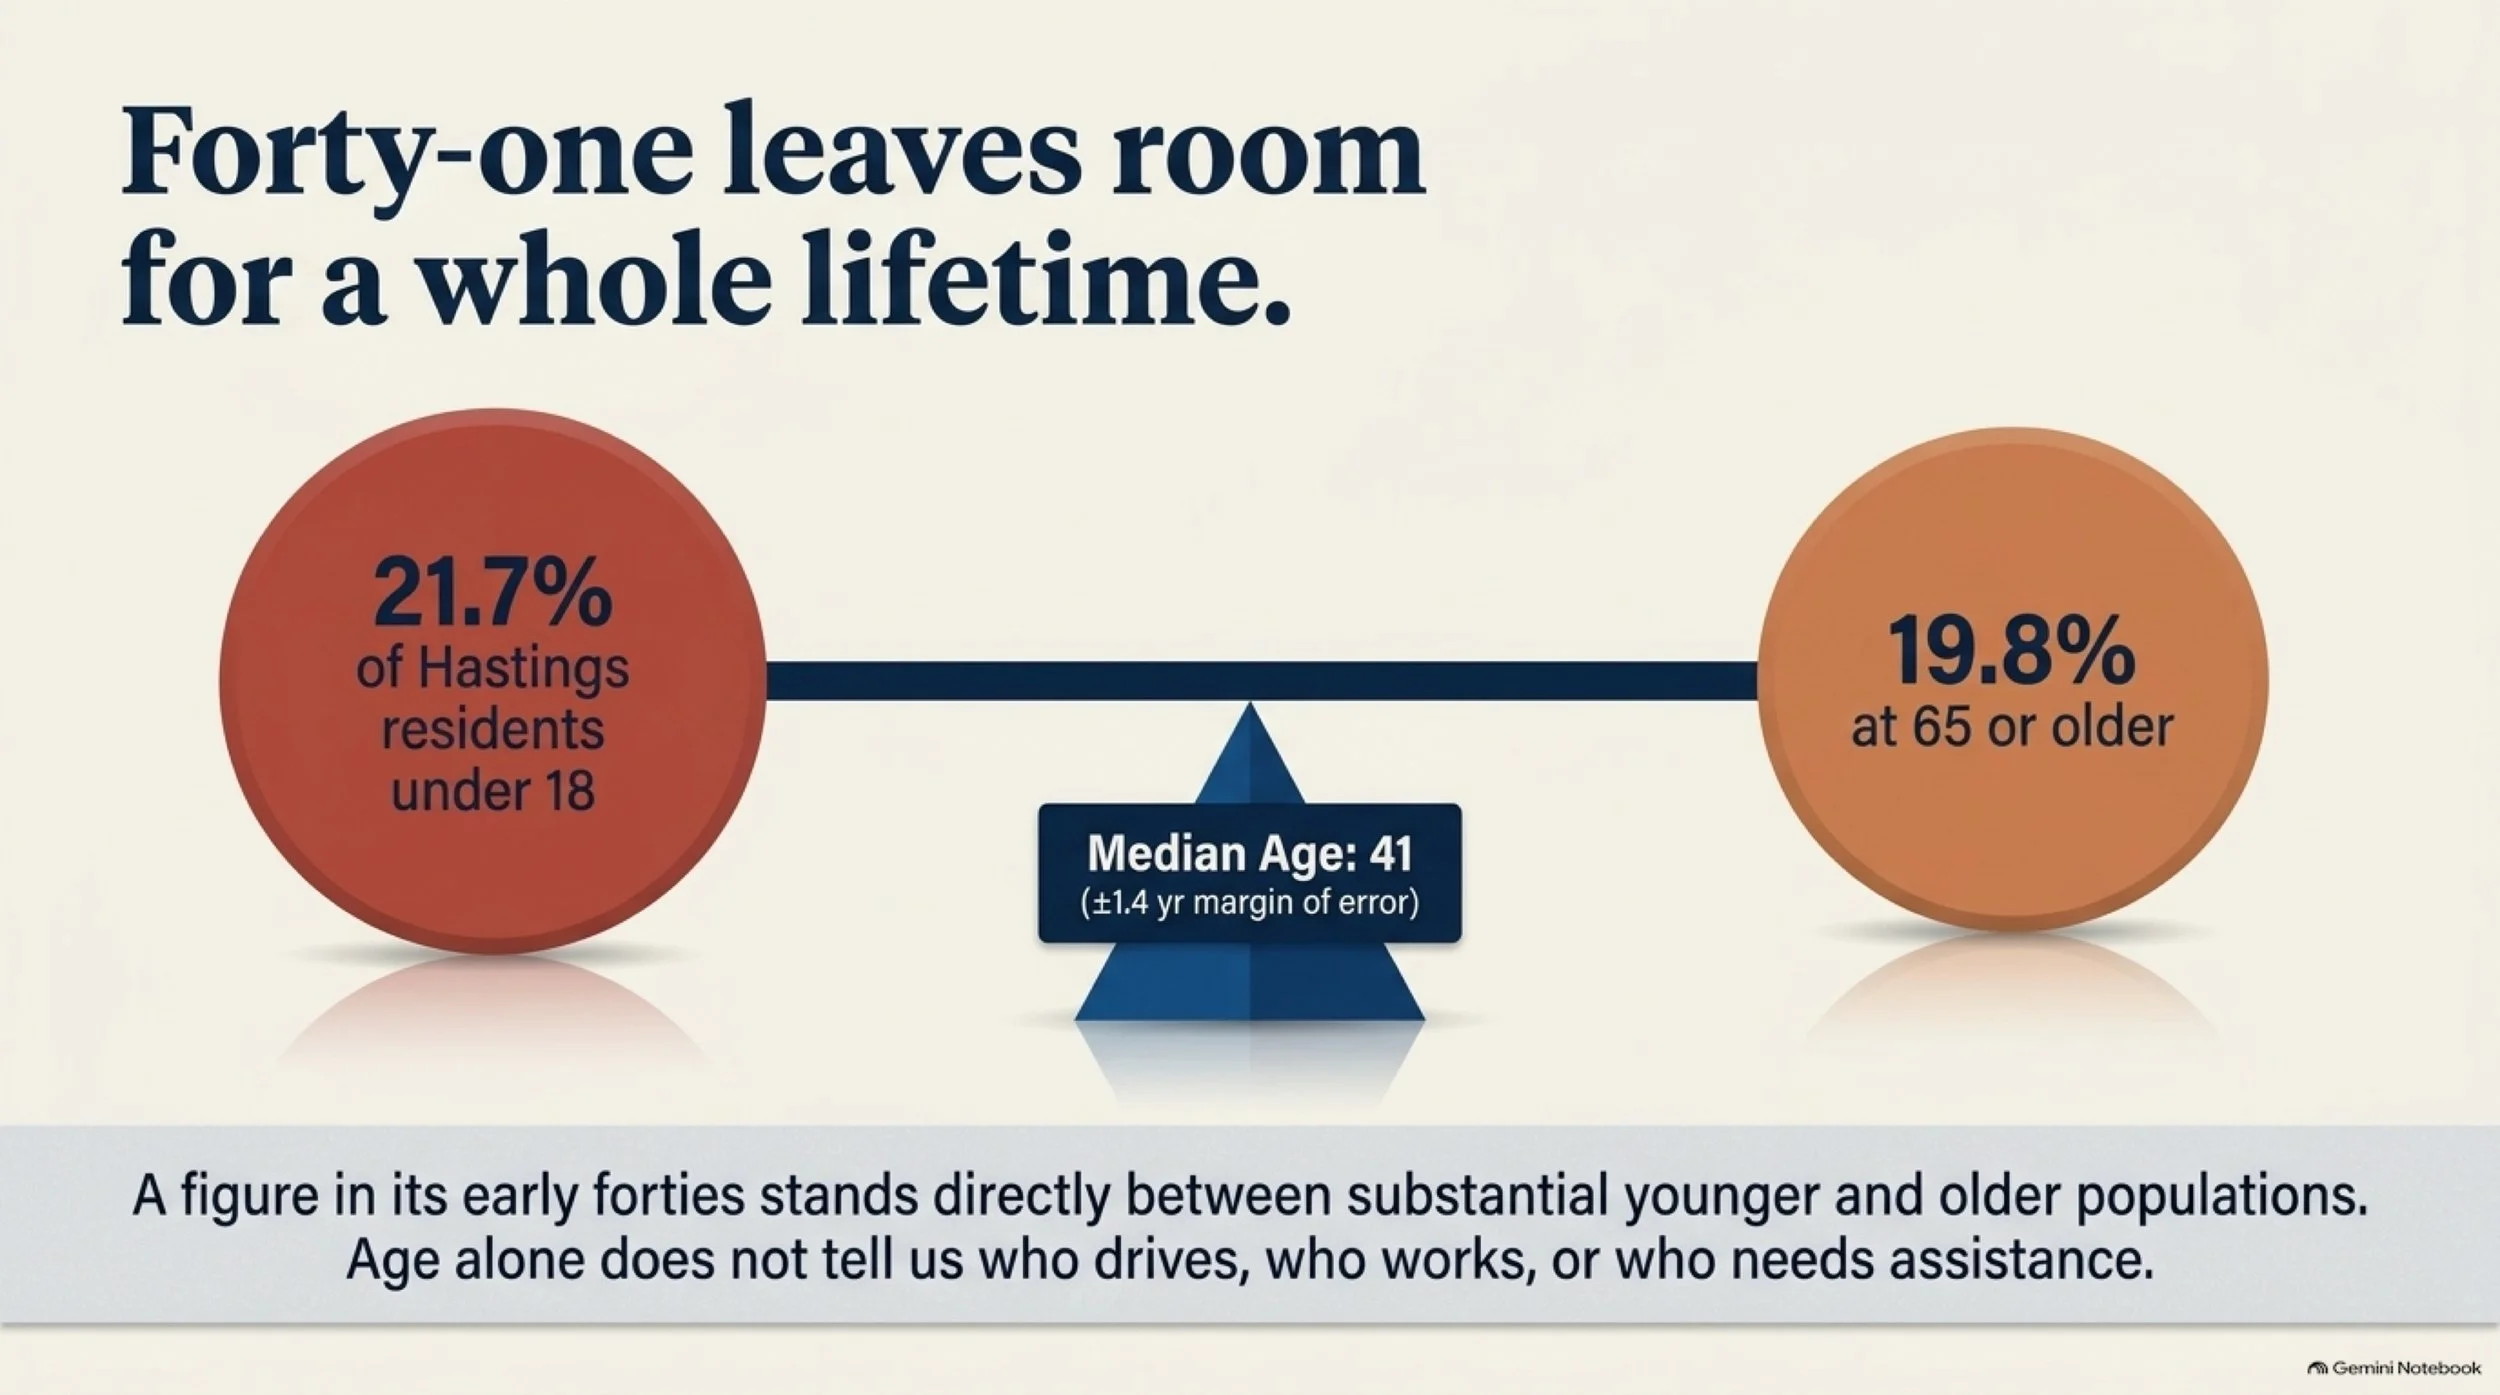
Forty-one leaves room for a whole lifetime
A median is a midpoint in an ordered distribution. It can help us find our bearings, but it cannot show the whole landscape.
The Census age estimates place 21.7% of Hastings residents under 18 and 19.8% at 65 or older. A figure in its early forties therefore stands between substantial younger and older populations.
Pause over that before imagining what a community needs.
A question about crossing a road might look different to someone accompanying a child than to someone driving through an intersection. A daytime service may be convenient for one household and difficult for another. A teenager and an older neighbor might both value an accessible public place, for reasons we would need to ask them about.
These are possibilities to investigate, not experiences established by the age table. Age alone does not tell us who drives, who works, who needs assistance or who wants a particular change.
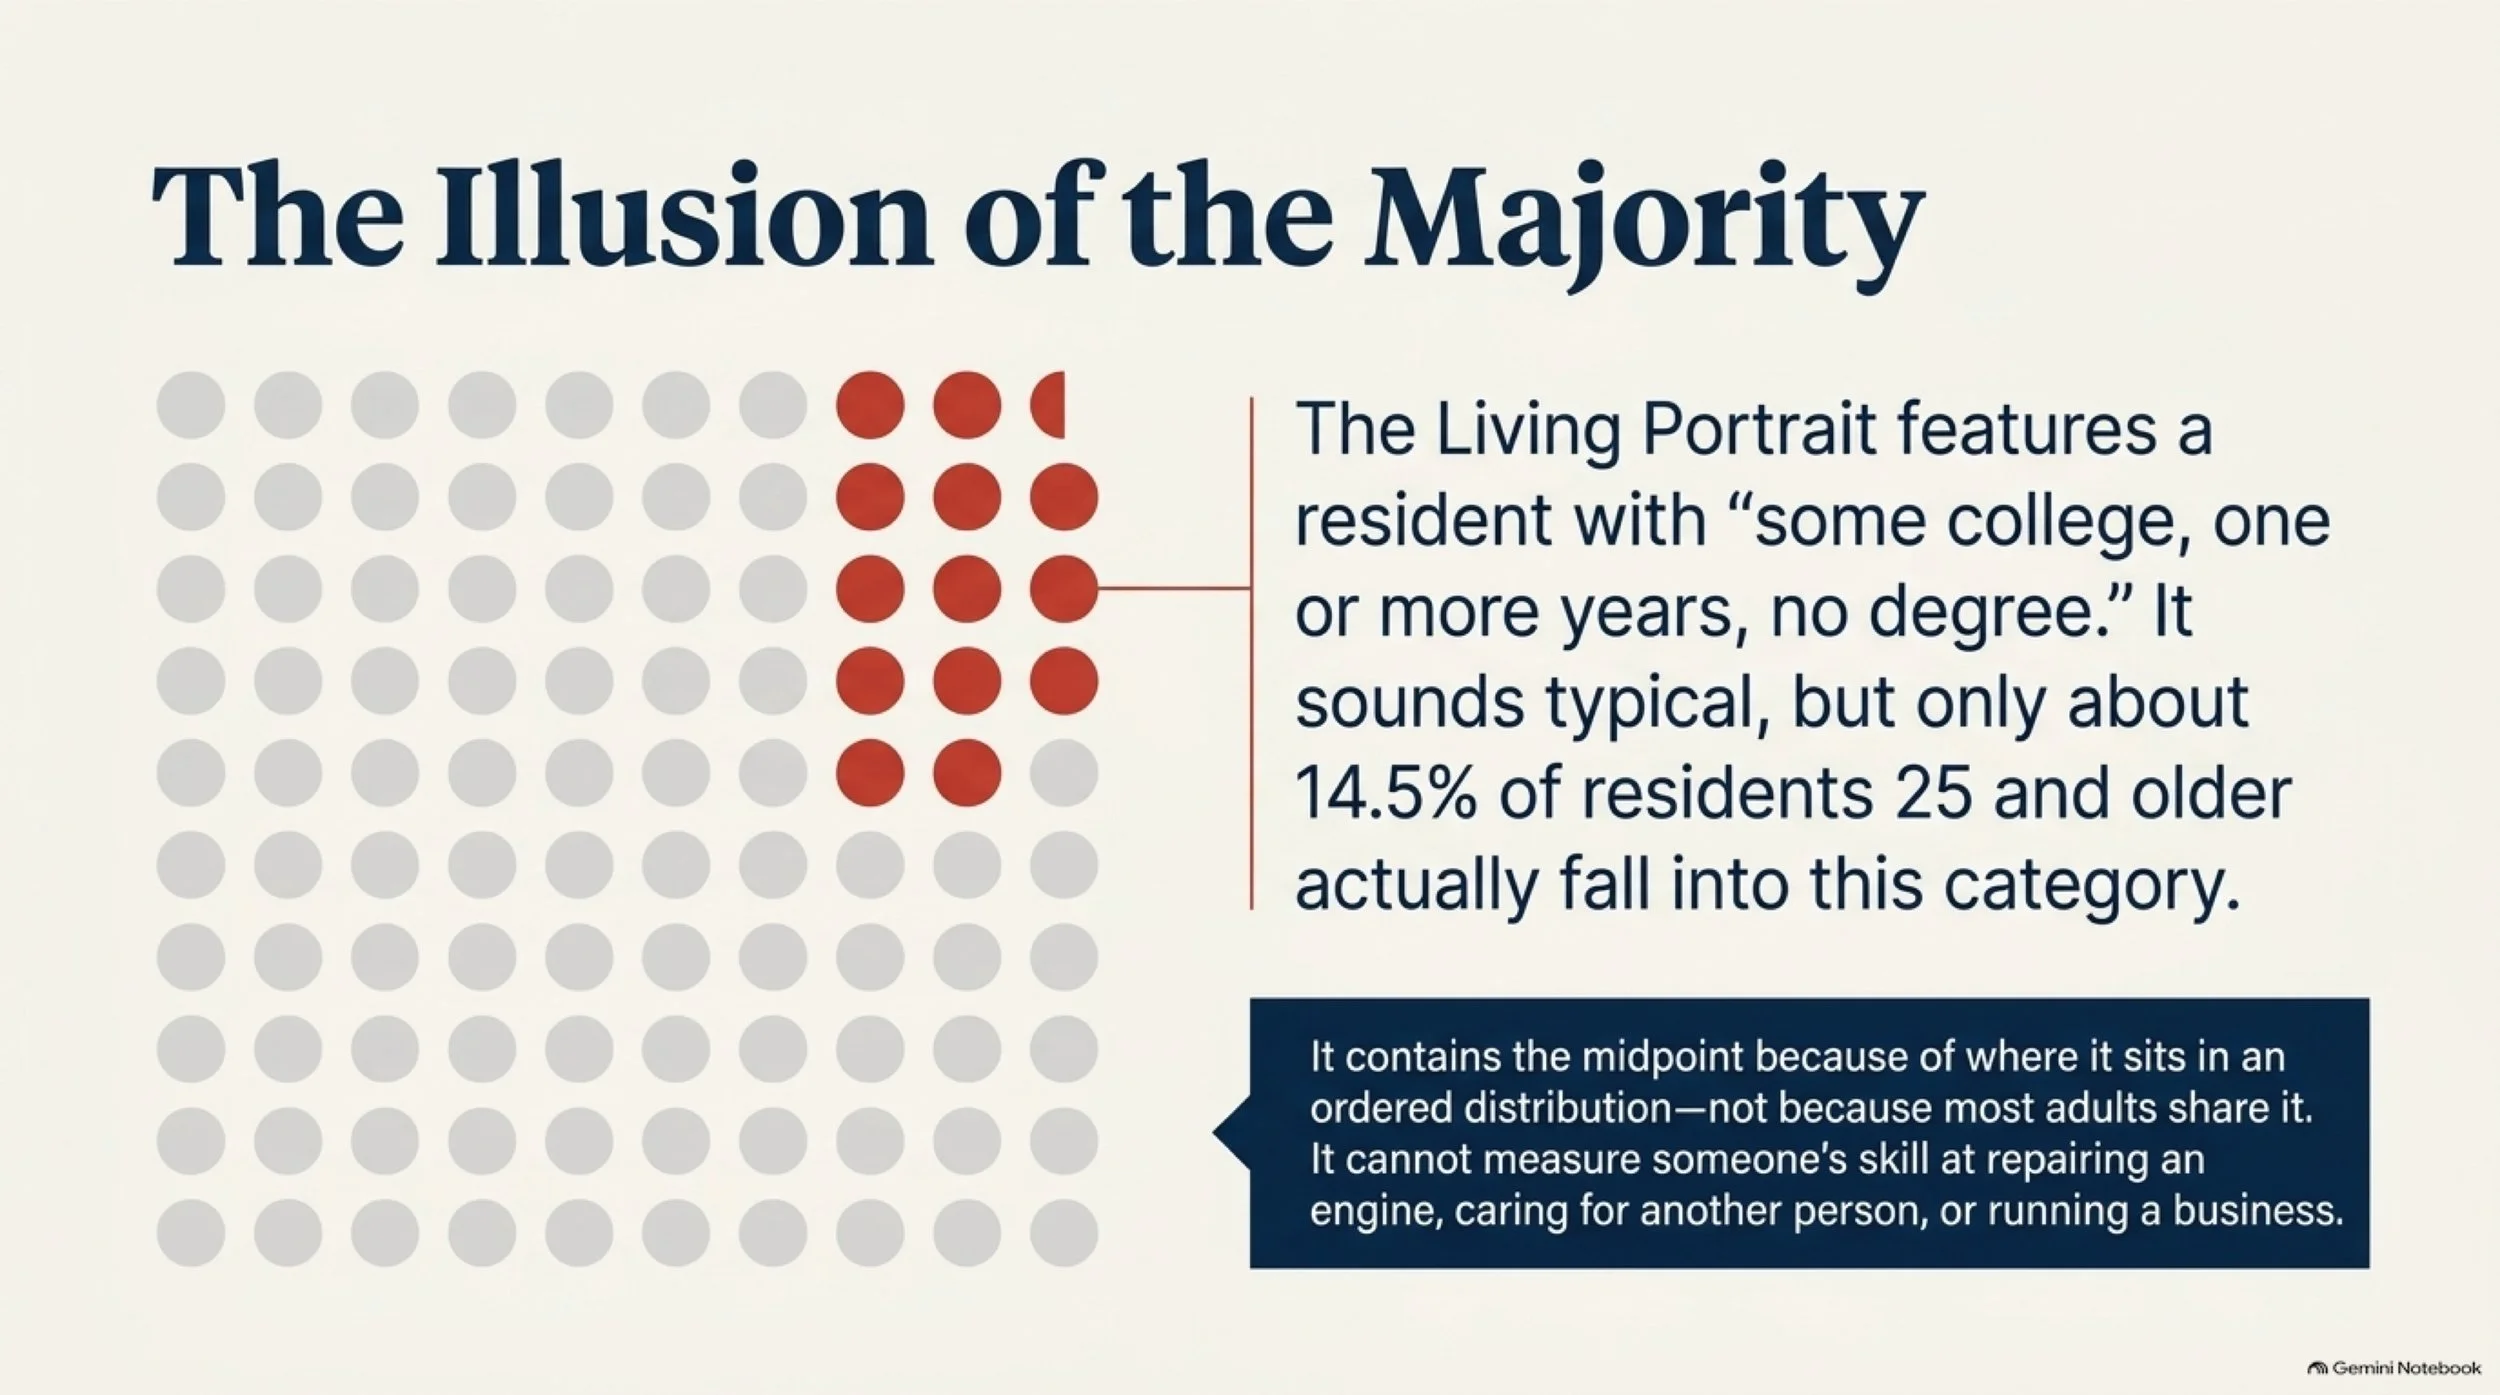
Even the education reference contains a useful surprise. Only about 14.5% of residents 25 and older fall into the particular category selected for the portrait. It contains the midpoint because of where it sits in the ordered distribution, not because most adults share it.
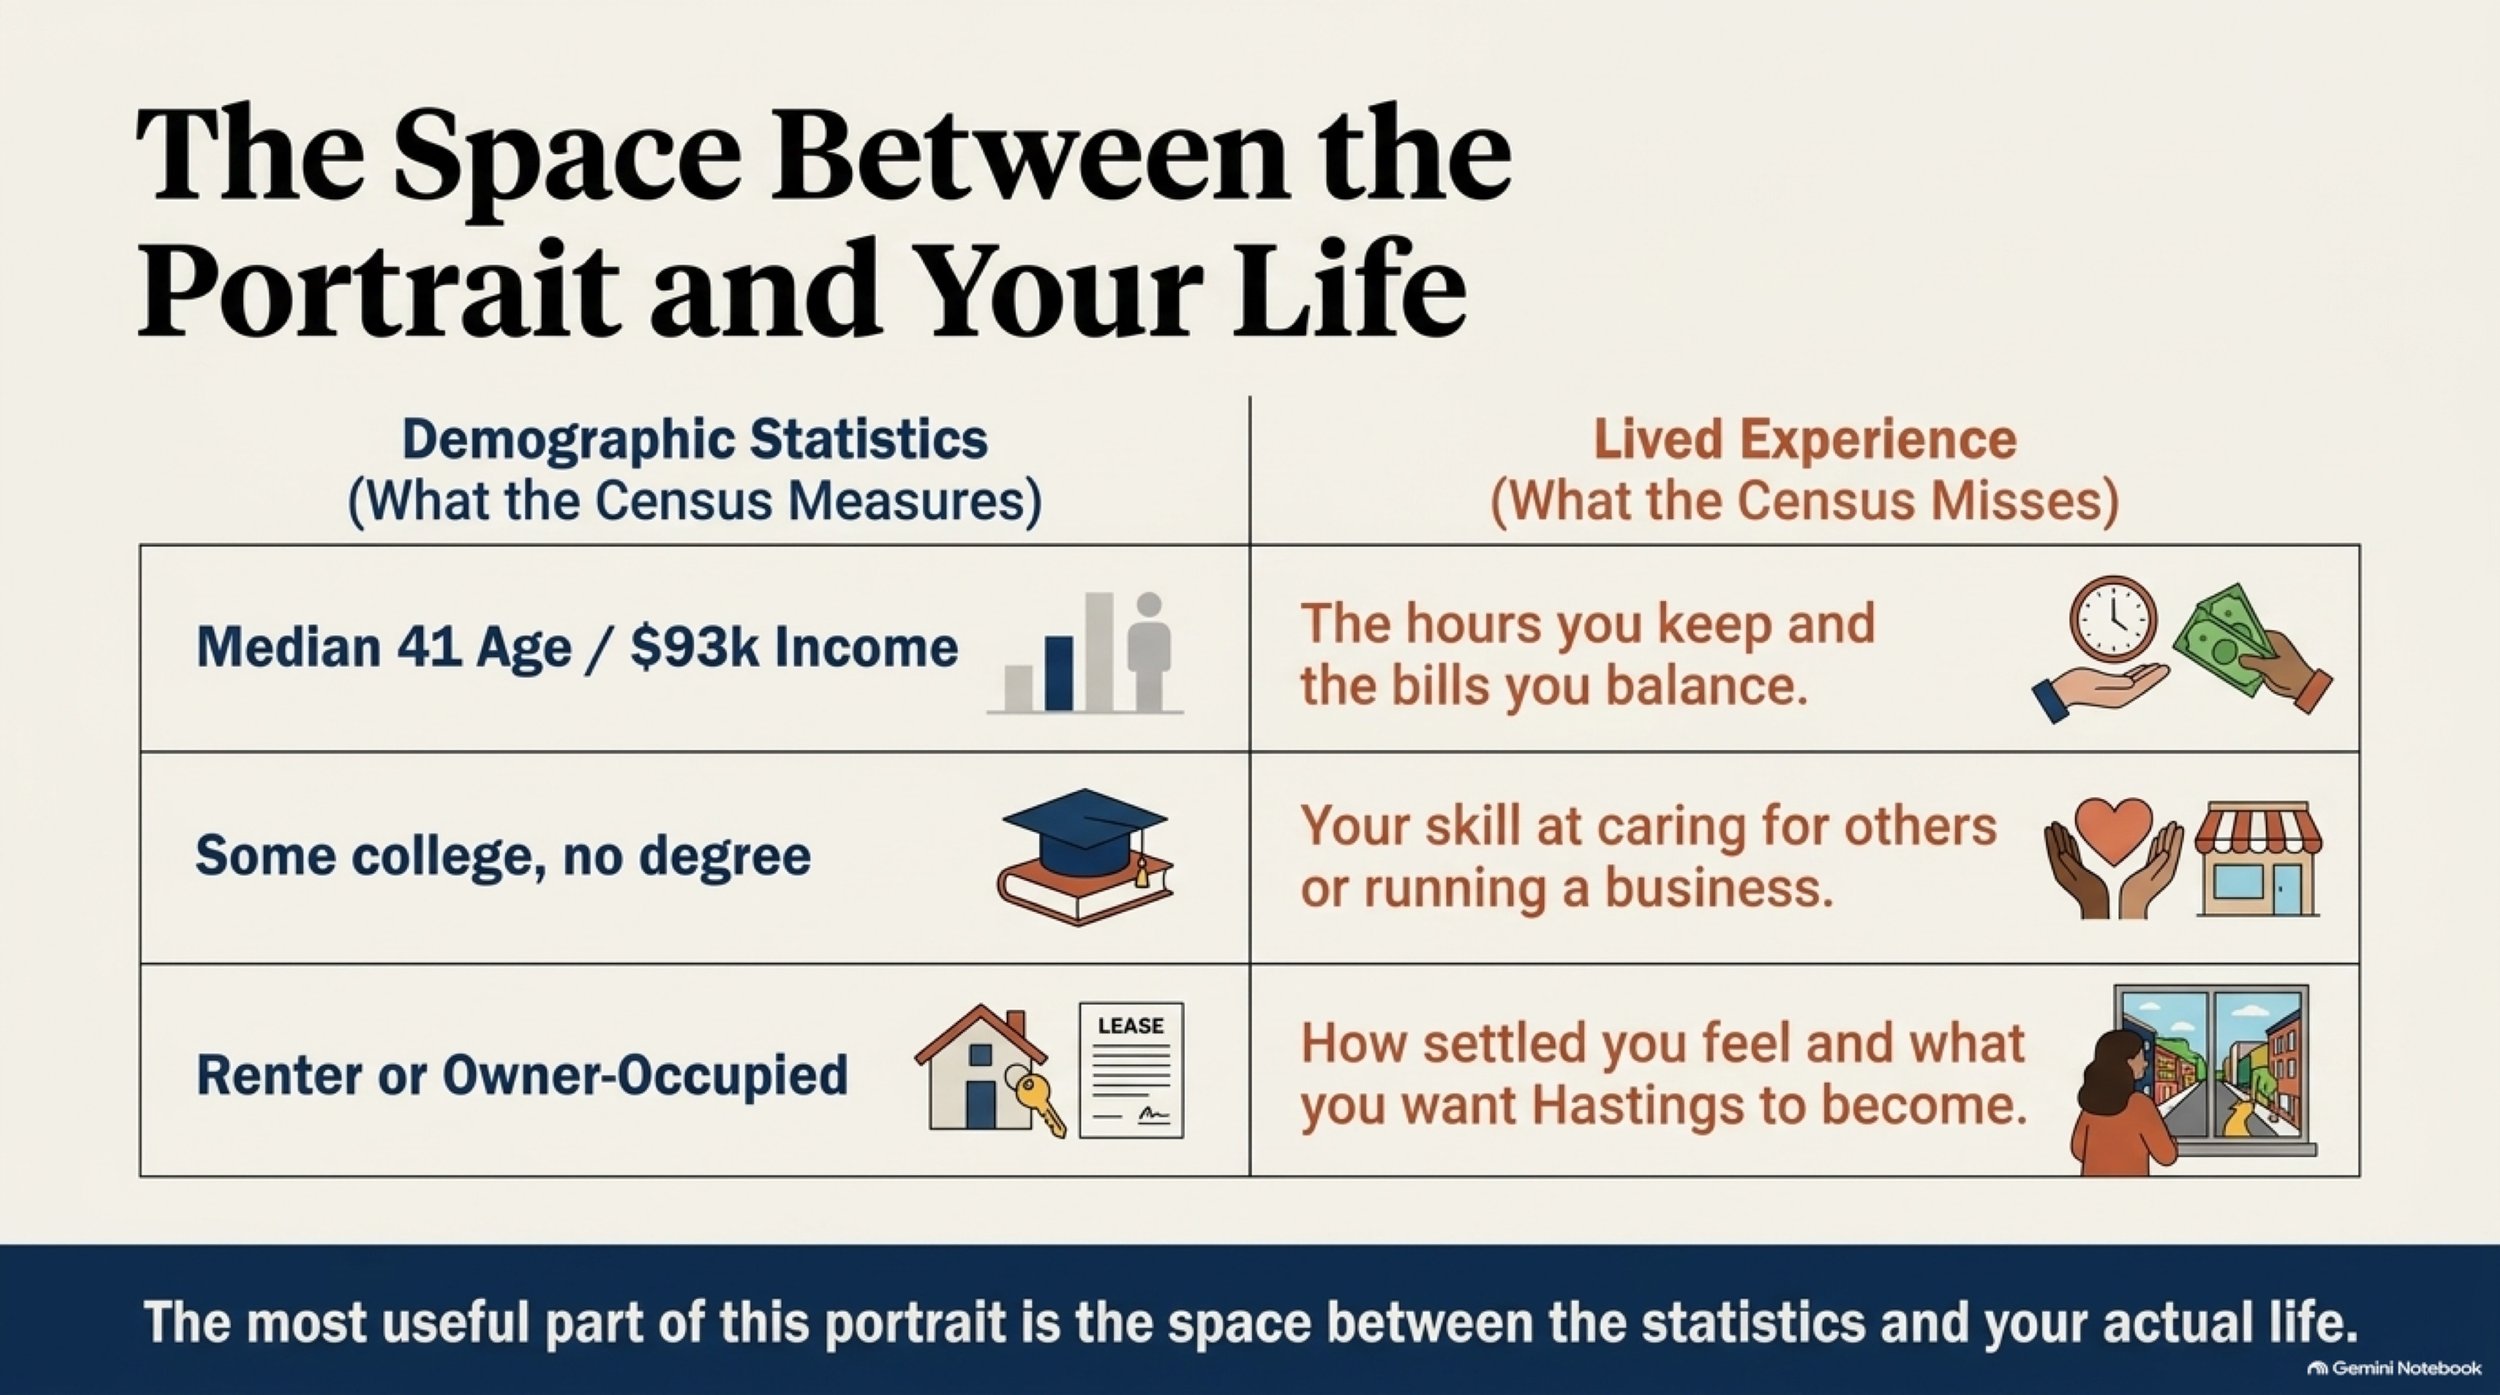
Put the categories in order, accumulate their estimated counts, and the halfway point falls within “some college, one or more years, no degree.” That tells us about educational attainment. It cannot measure someone’s skill at repairing an engine, caring for another person, running a business or making a neighbor feel welcome.
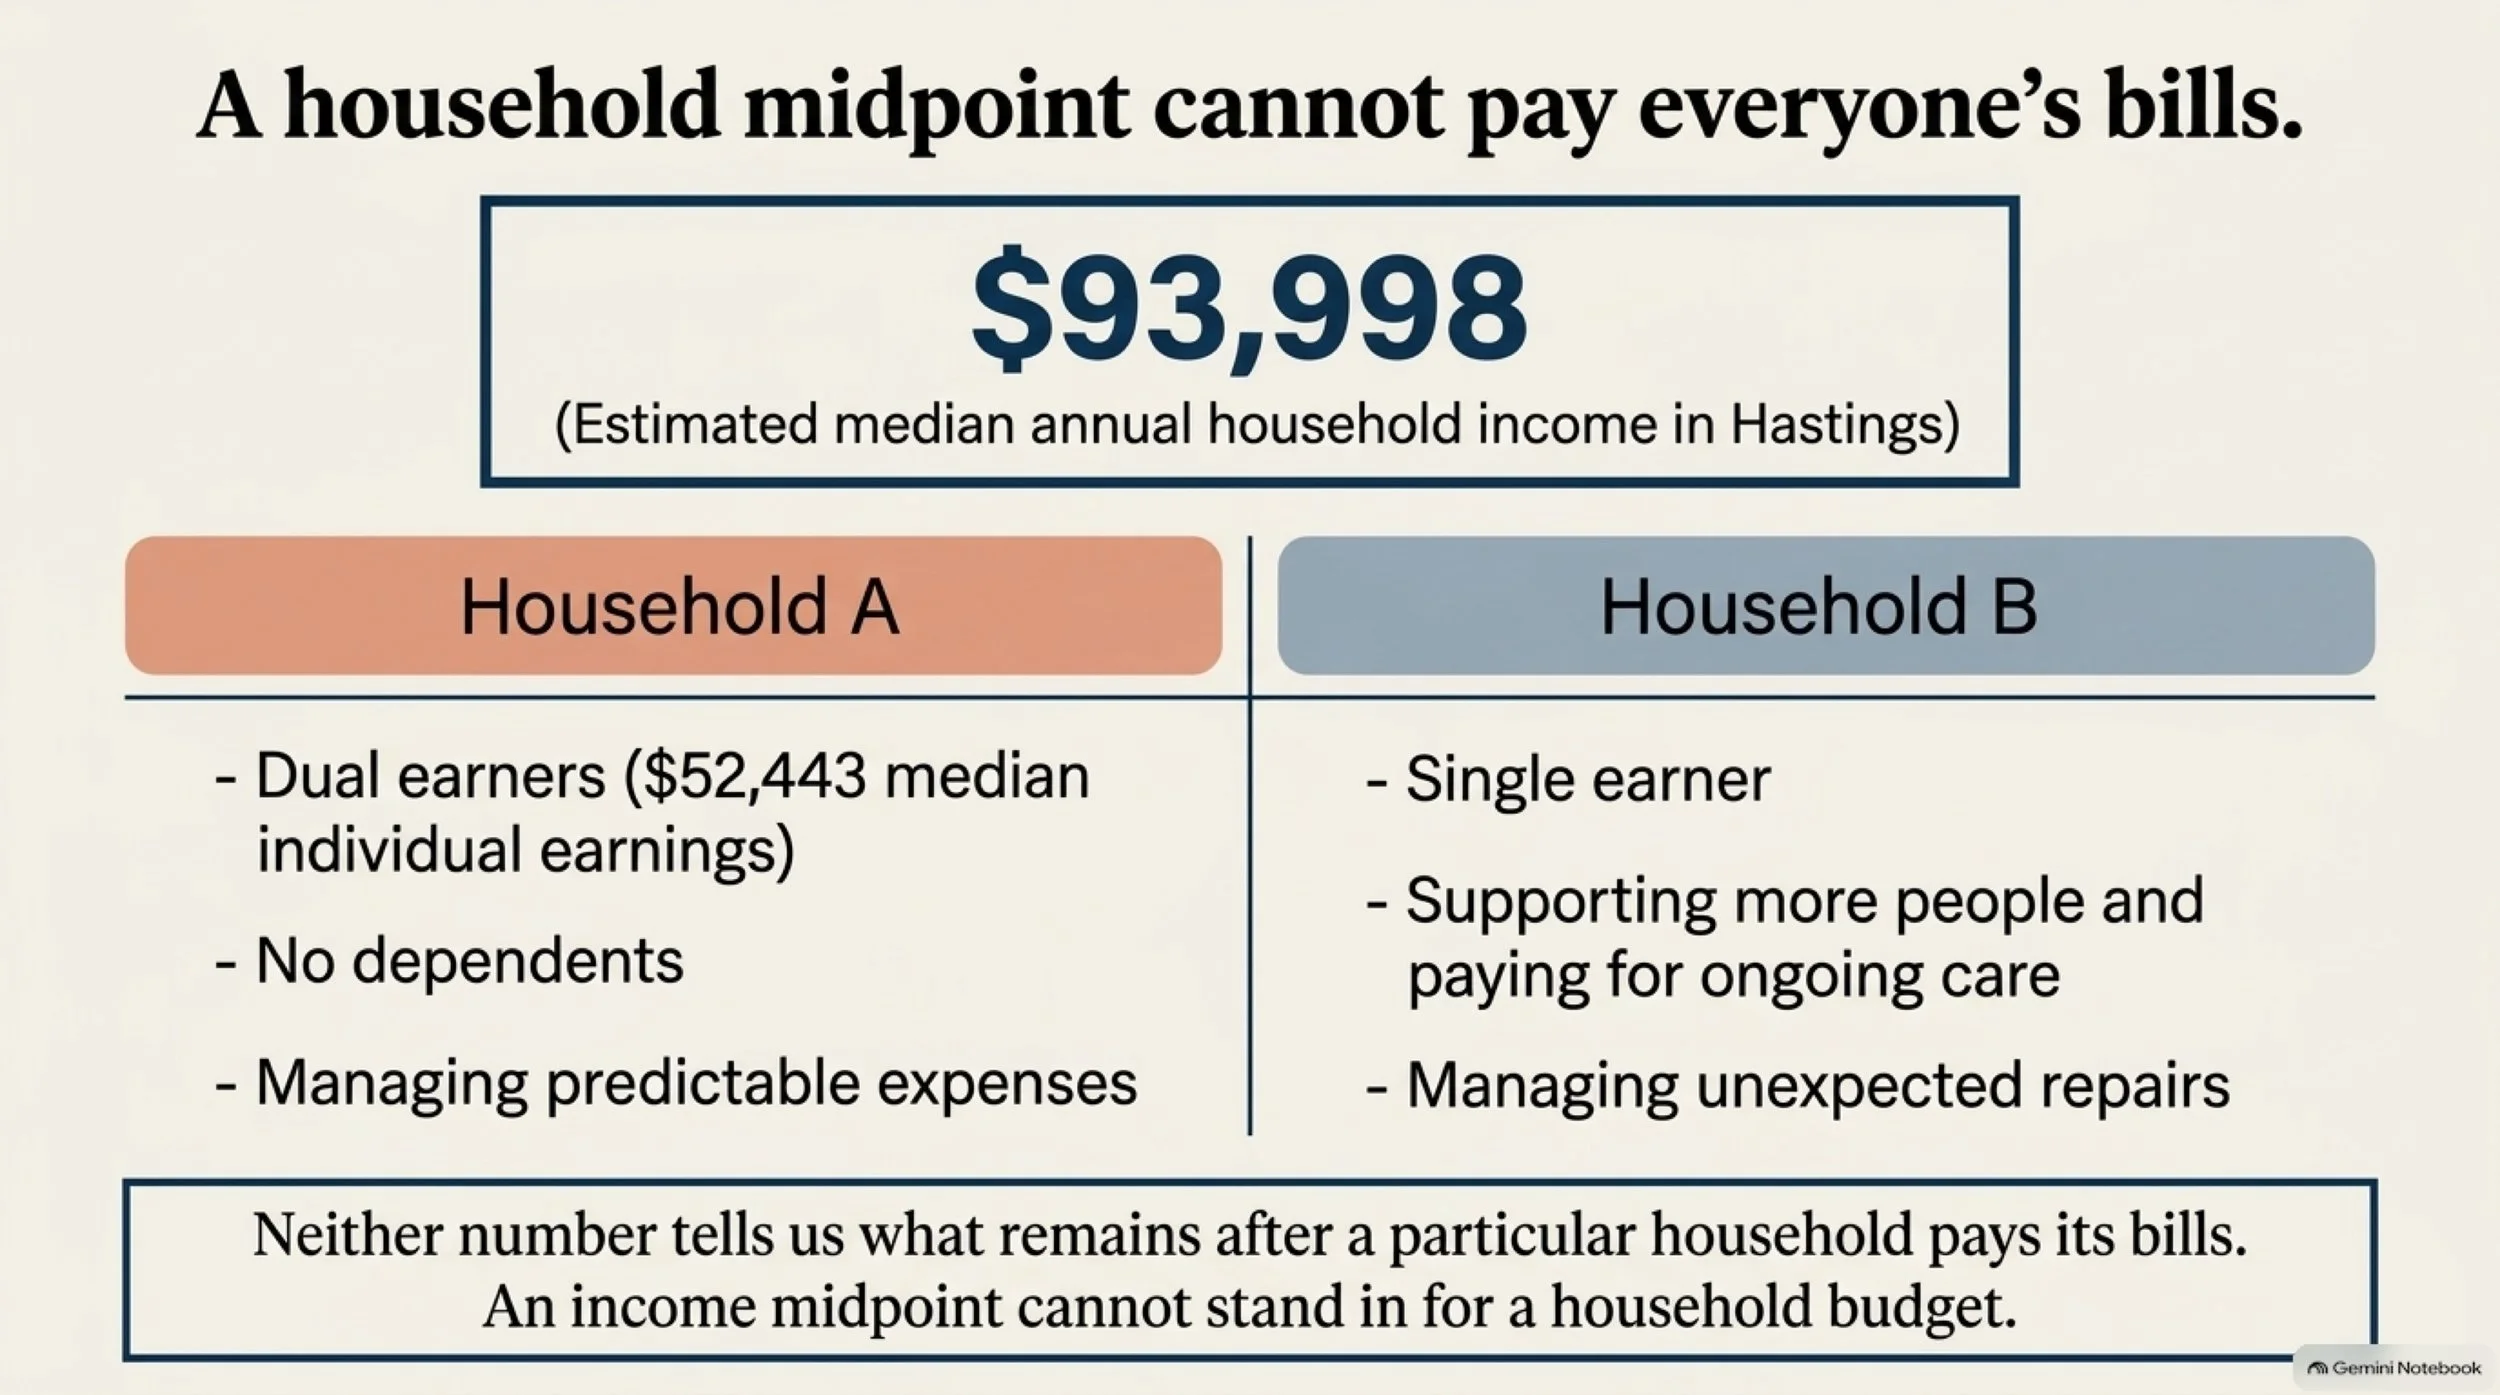
A household midpoint cannot pay everyone’s bills
The estimated median annual household income in Hastings is $93,998, expressed in 2024 dollars. Its published 90% margin of error is ±$5,229.
It is an important community reference. It is also easy to misread.
A household may have one earner or several. Its income can include sources beyond wages. The figure does not tell us that the person in this portrait earns nearly $94,000, or that every household has that amount to spend.
For a different question, the Census reports median annual earnings of $52,443 among people 16 and older who had earnings, also in 2024 dollars, with a published 90% margin of ±$4,048. This includes people working part time or part of the year. It is not a full-time salary estimate, and people without earnings are outside that measure.
Neither number tells us what remains after a particular household pays its bills.
Consider two households with the same income. One might be supporting more people, paying for care or managing an unexpected repair. Another might face different obligations. These are hypothetical circumstances, but they explain why an income midpoint cannot stand in for a household budget.
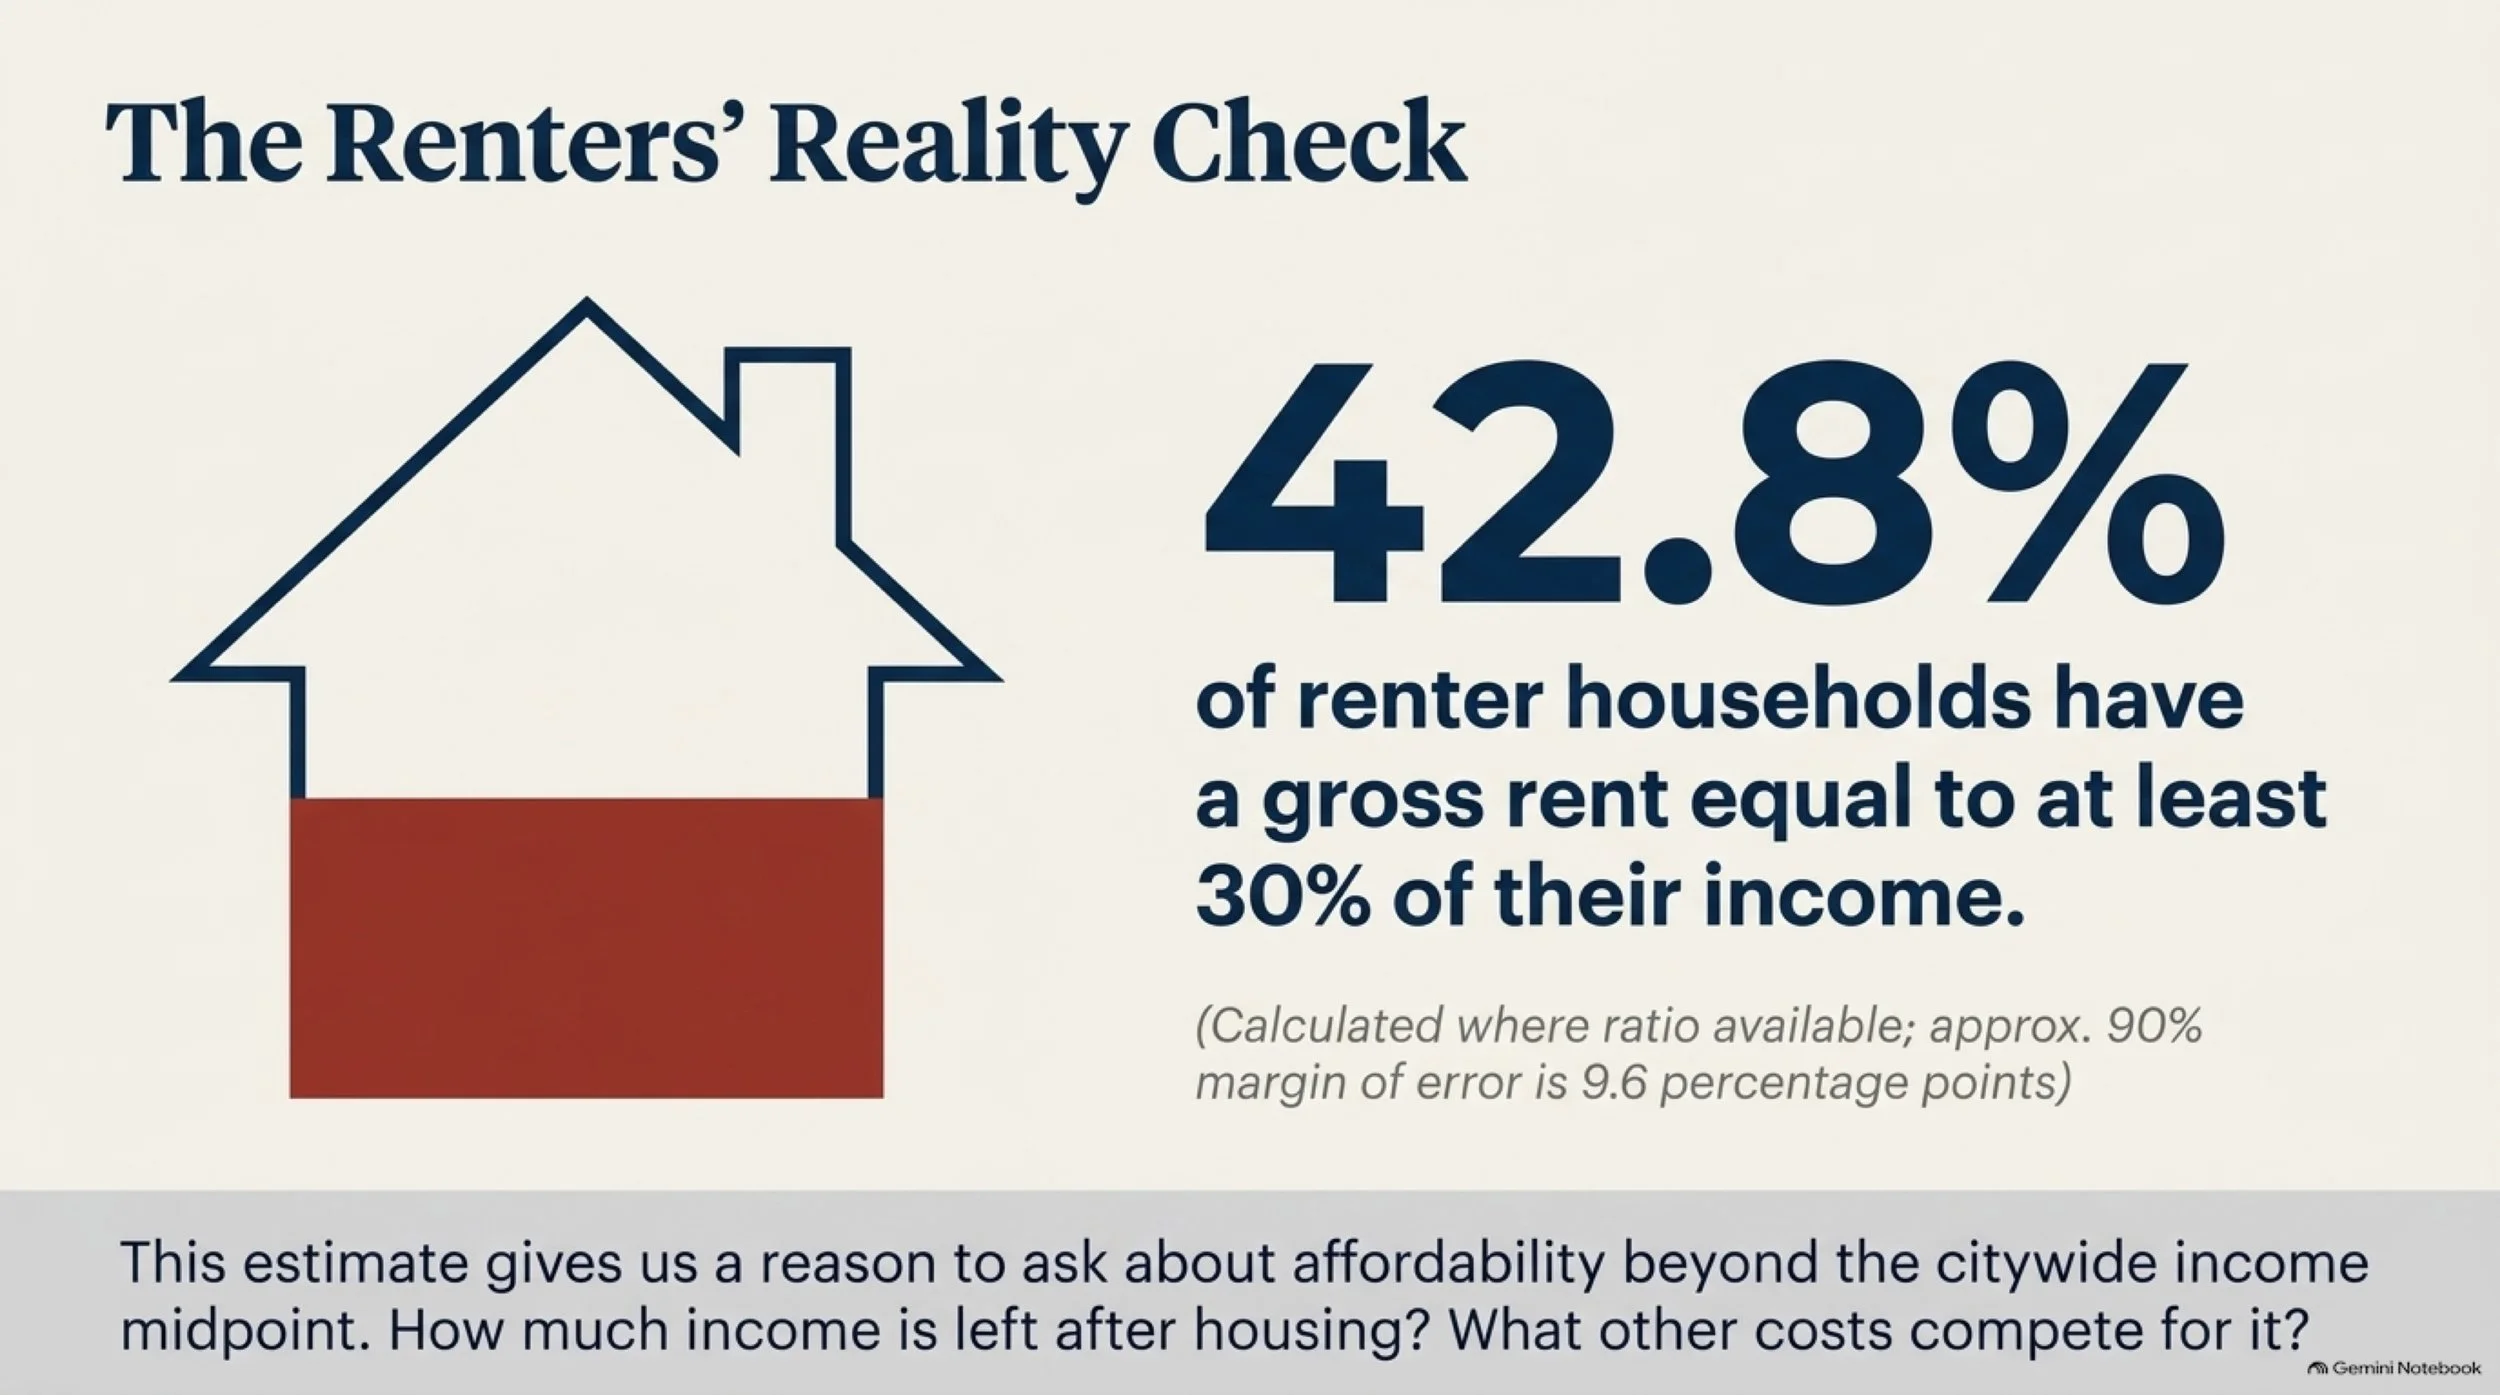
Housing costs offer one measurable reason to look more closely. Among renter-occupied homes for which the rent-to-income ratio could be calculated, an estimated 42.8% had gross rent equal to at least 30% of household income. Gross rent includes applicable tenant-paid utilities.
That estimate has substantial uncertainty: its approximate 90% margin of error is 9.6 percentage points. It does not establish that most renter households cross the threshold, and it does not describe all residents. Cases without a calculable ratio were excluded.
It does give us a reason to ask about affordability beyond the citywide income midpoint. How much income is left after housing? What other costs compete for it? Which circumstances do summary figures leave difficult to see?
Living in an owned home is a different fact from owning one
Our reference lives in owner-occupied housing. That wording matters.
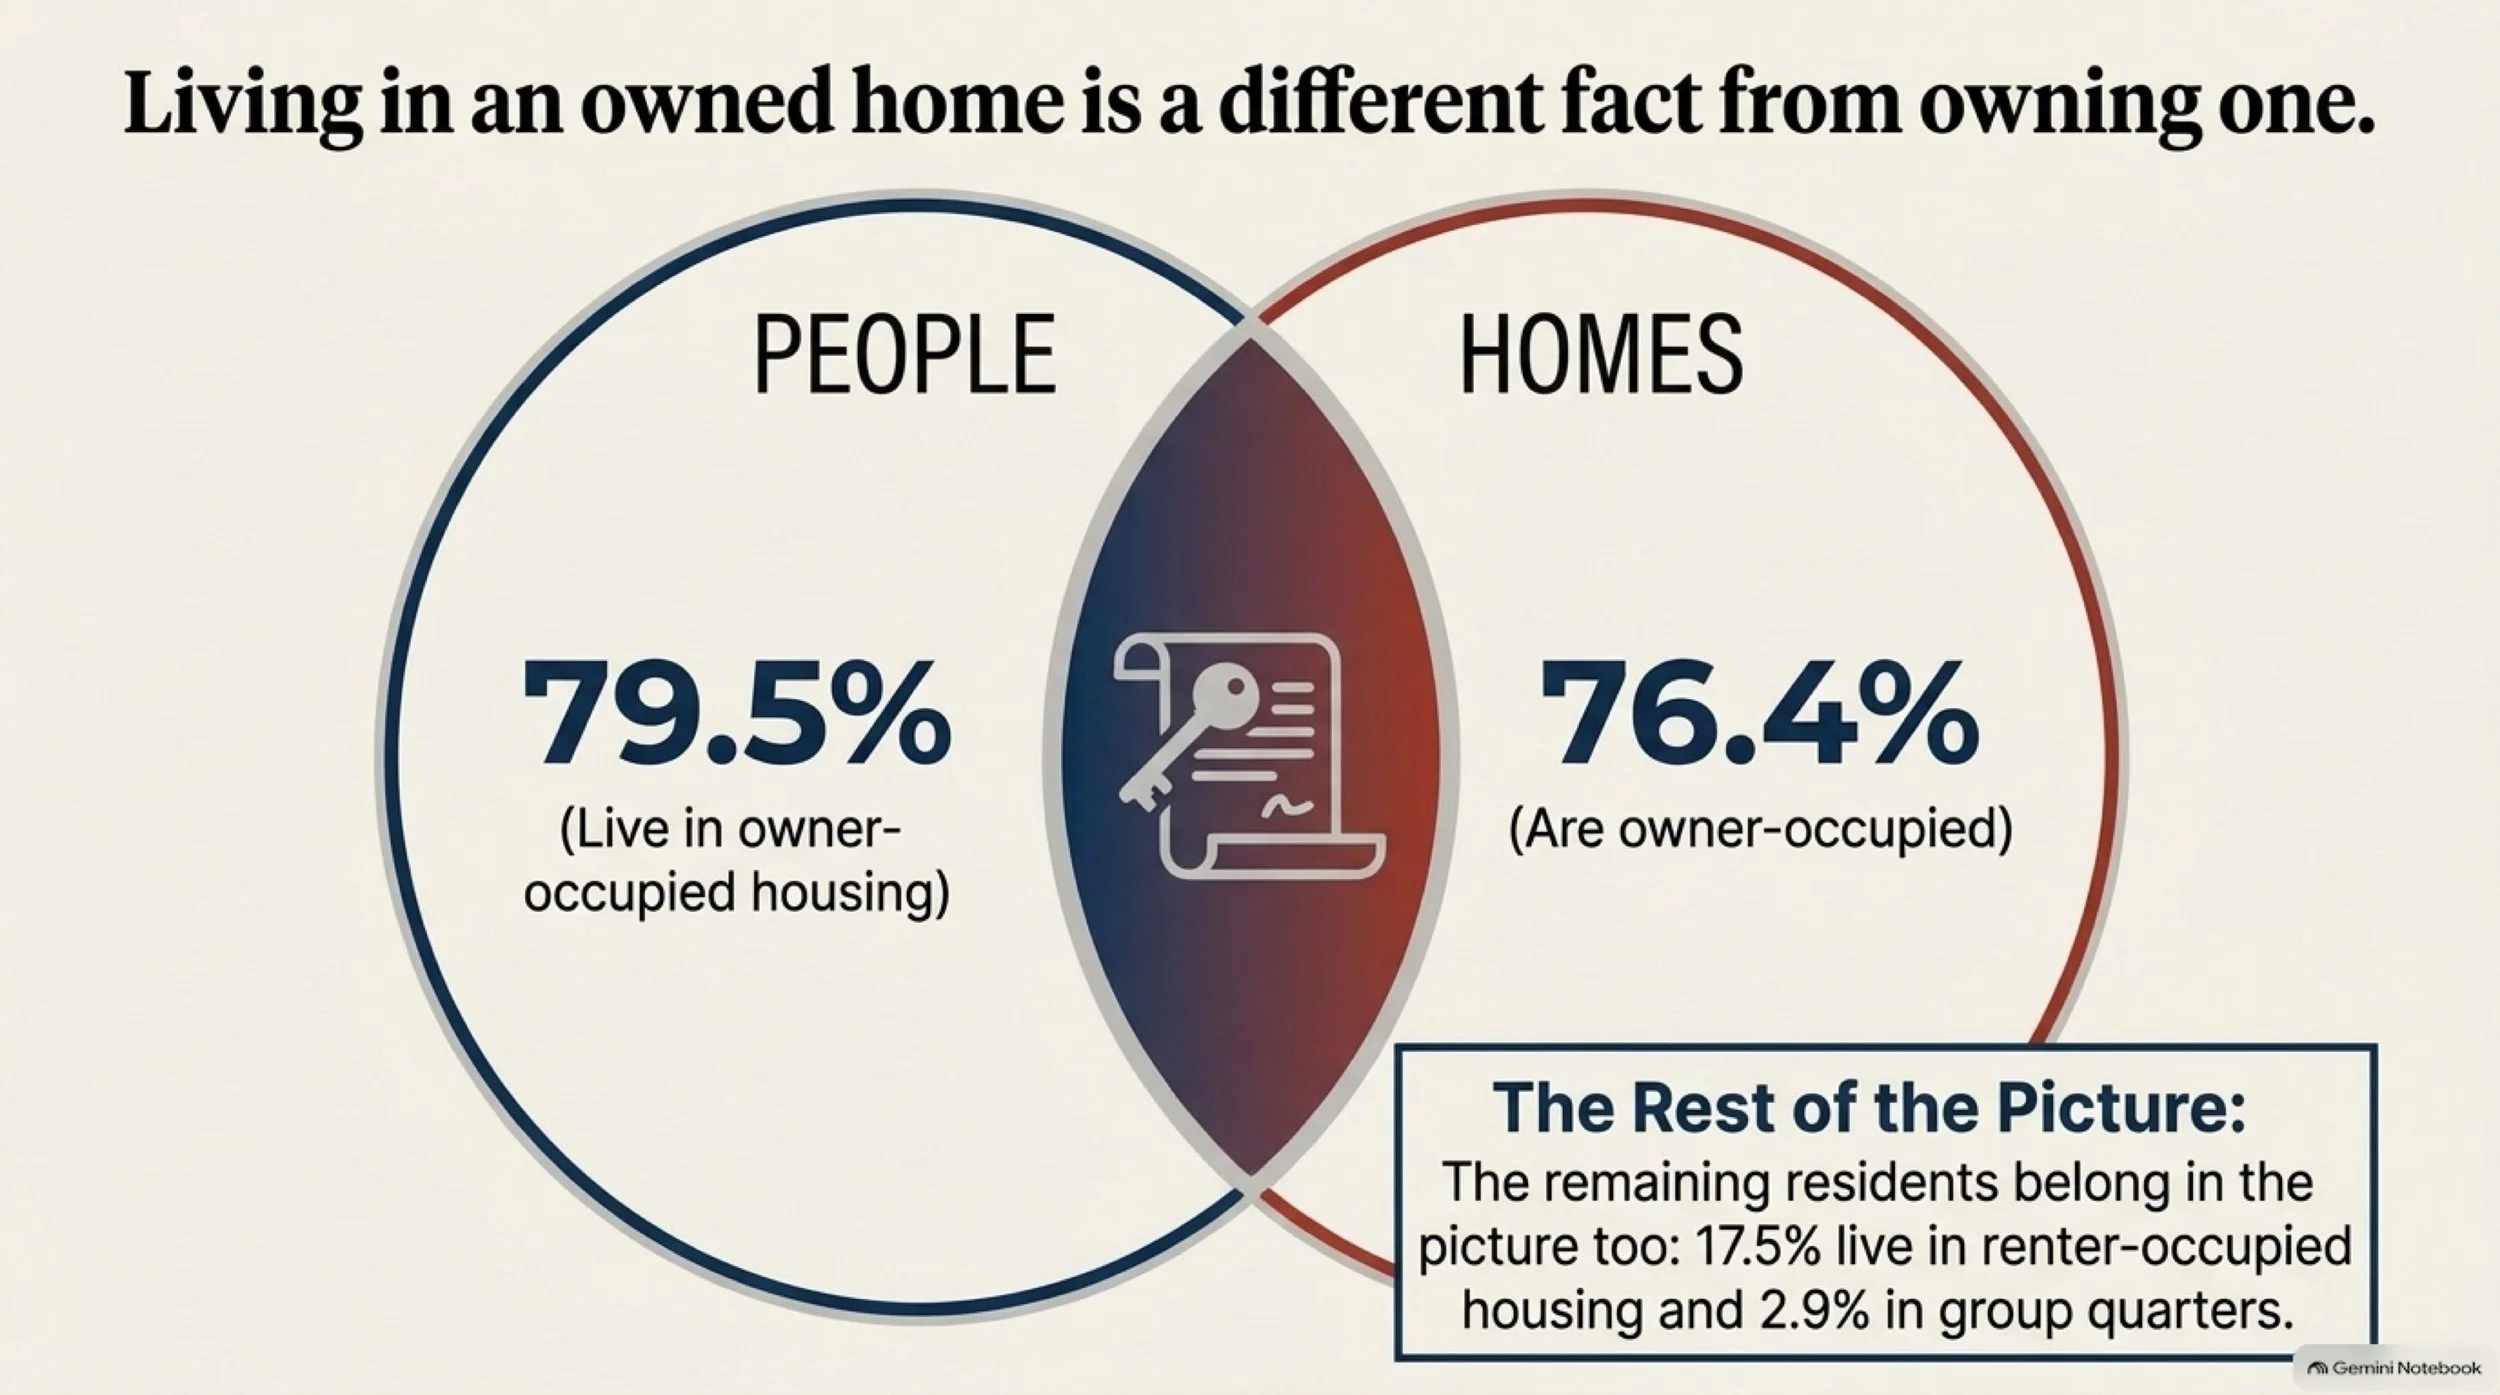
A child can live in an owned home without holding a deed. So can another household member. The Census definition means an owner or co-owner lives in the home; it does not make every occupant a property owner.
Counting people produces the portrait’s 79.5% estimate. Counting occupied homes produces a different figure: 76.4% are owner-occupied. Both can be correct because they answer different questions.
The remaining residents belong in the picture too. The estimates place 17.5% in renter-occupied housing and 2.9% in group quarters, the Census category for institutional and other group living arrangements. Together with residents in owner-occupied homes, those categories cover the full population used here.
Housing status alone cannot tell us how settled someone feels, how long they plan to stay, how much they contribute or what they want Hastings to become.
The prevalence of owner-occupied housing does not settle what housing should be built next. That requires evidence about prices, availability, accessibility and the circumstances of people seeking a place to live.
This is where the portrait can help us ask better questions about decisions already in front of the community.
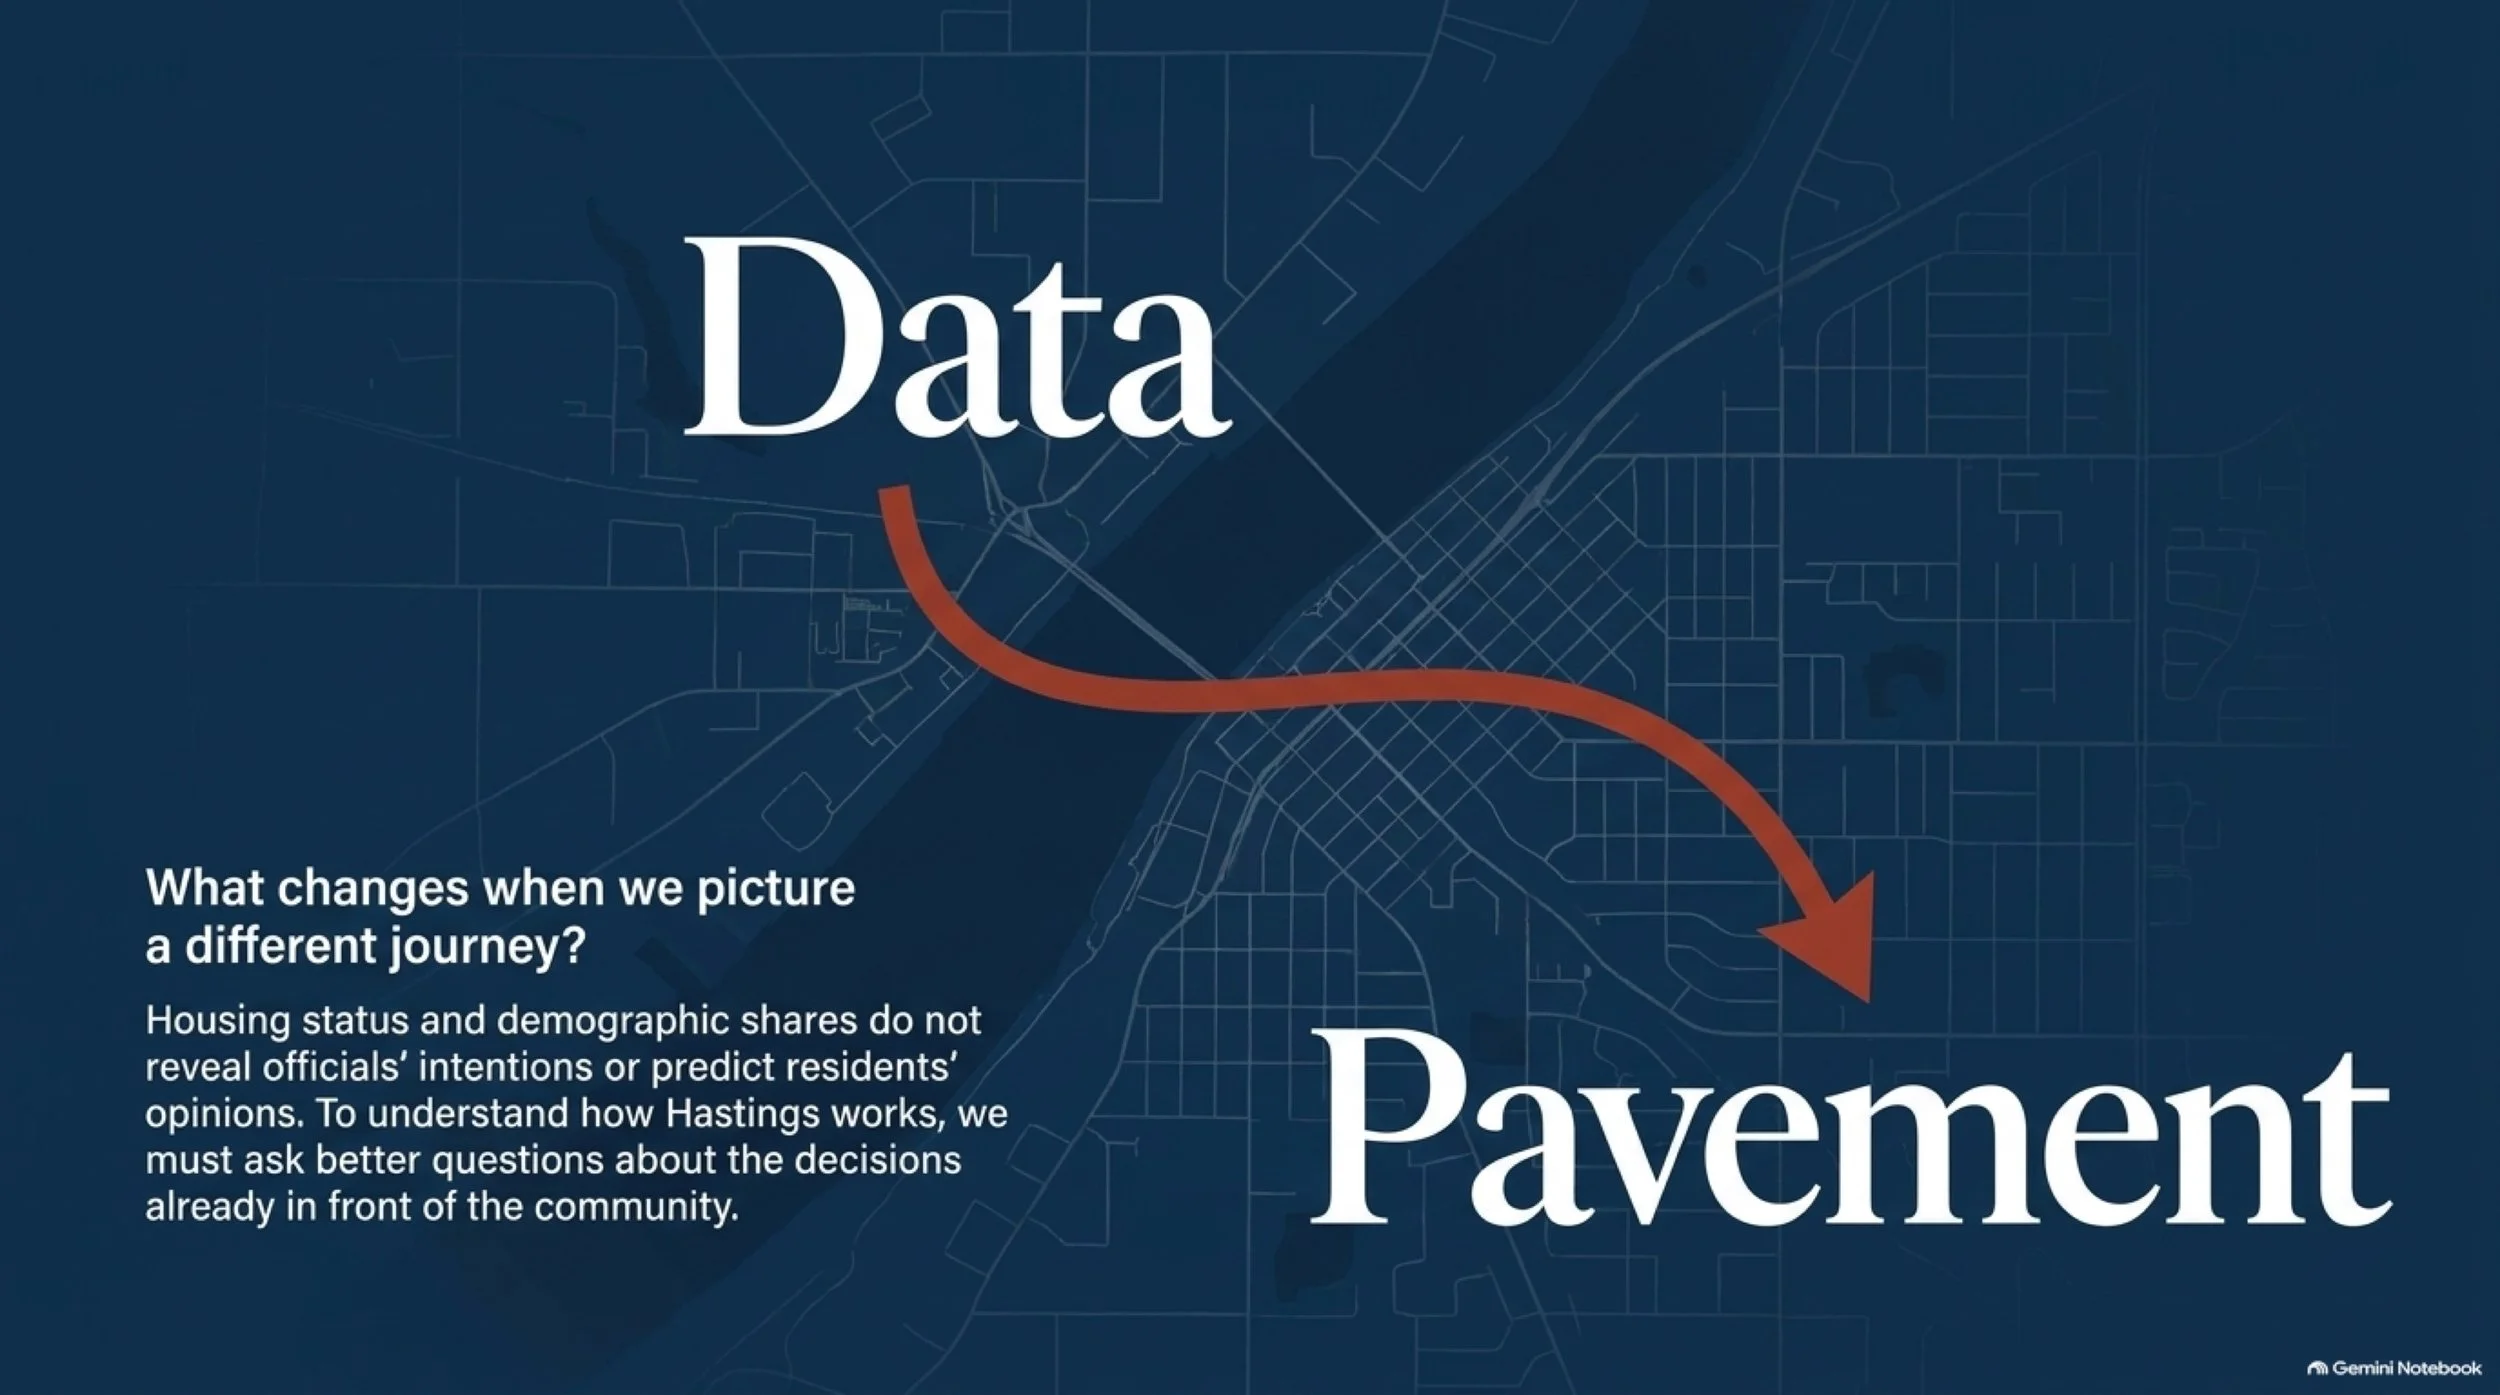
What changes when we picture a different journey?
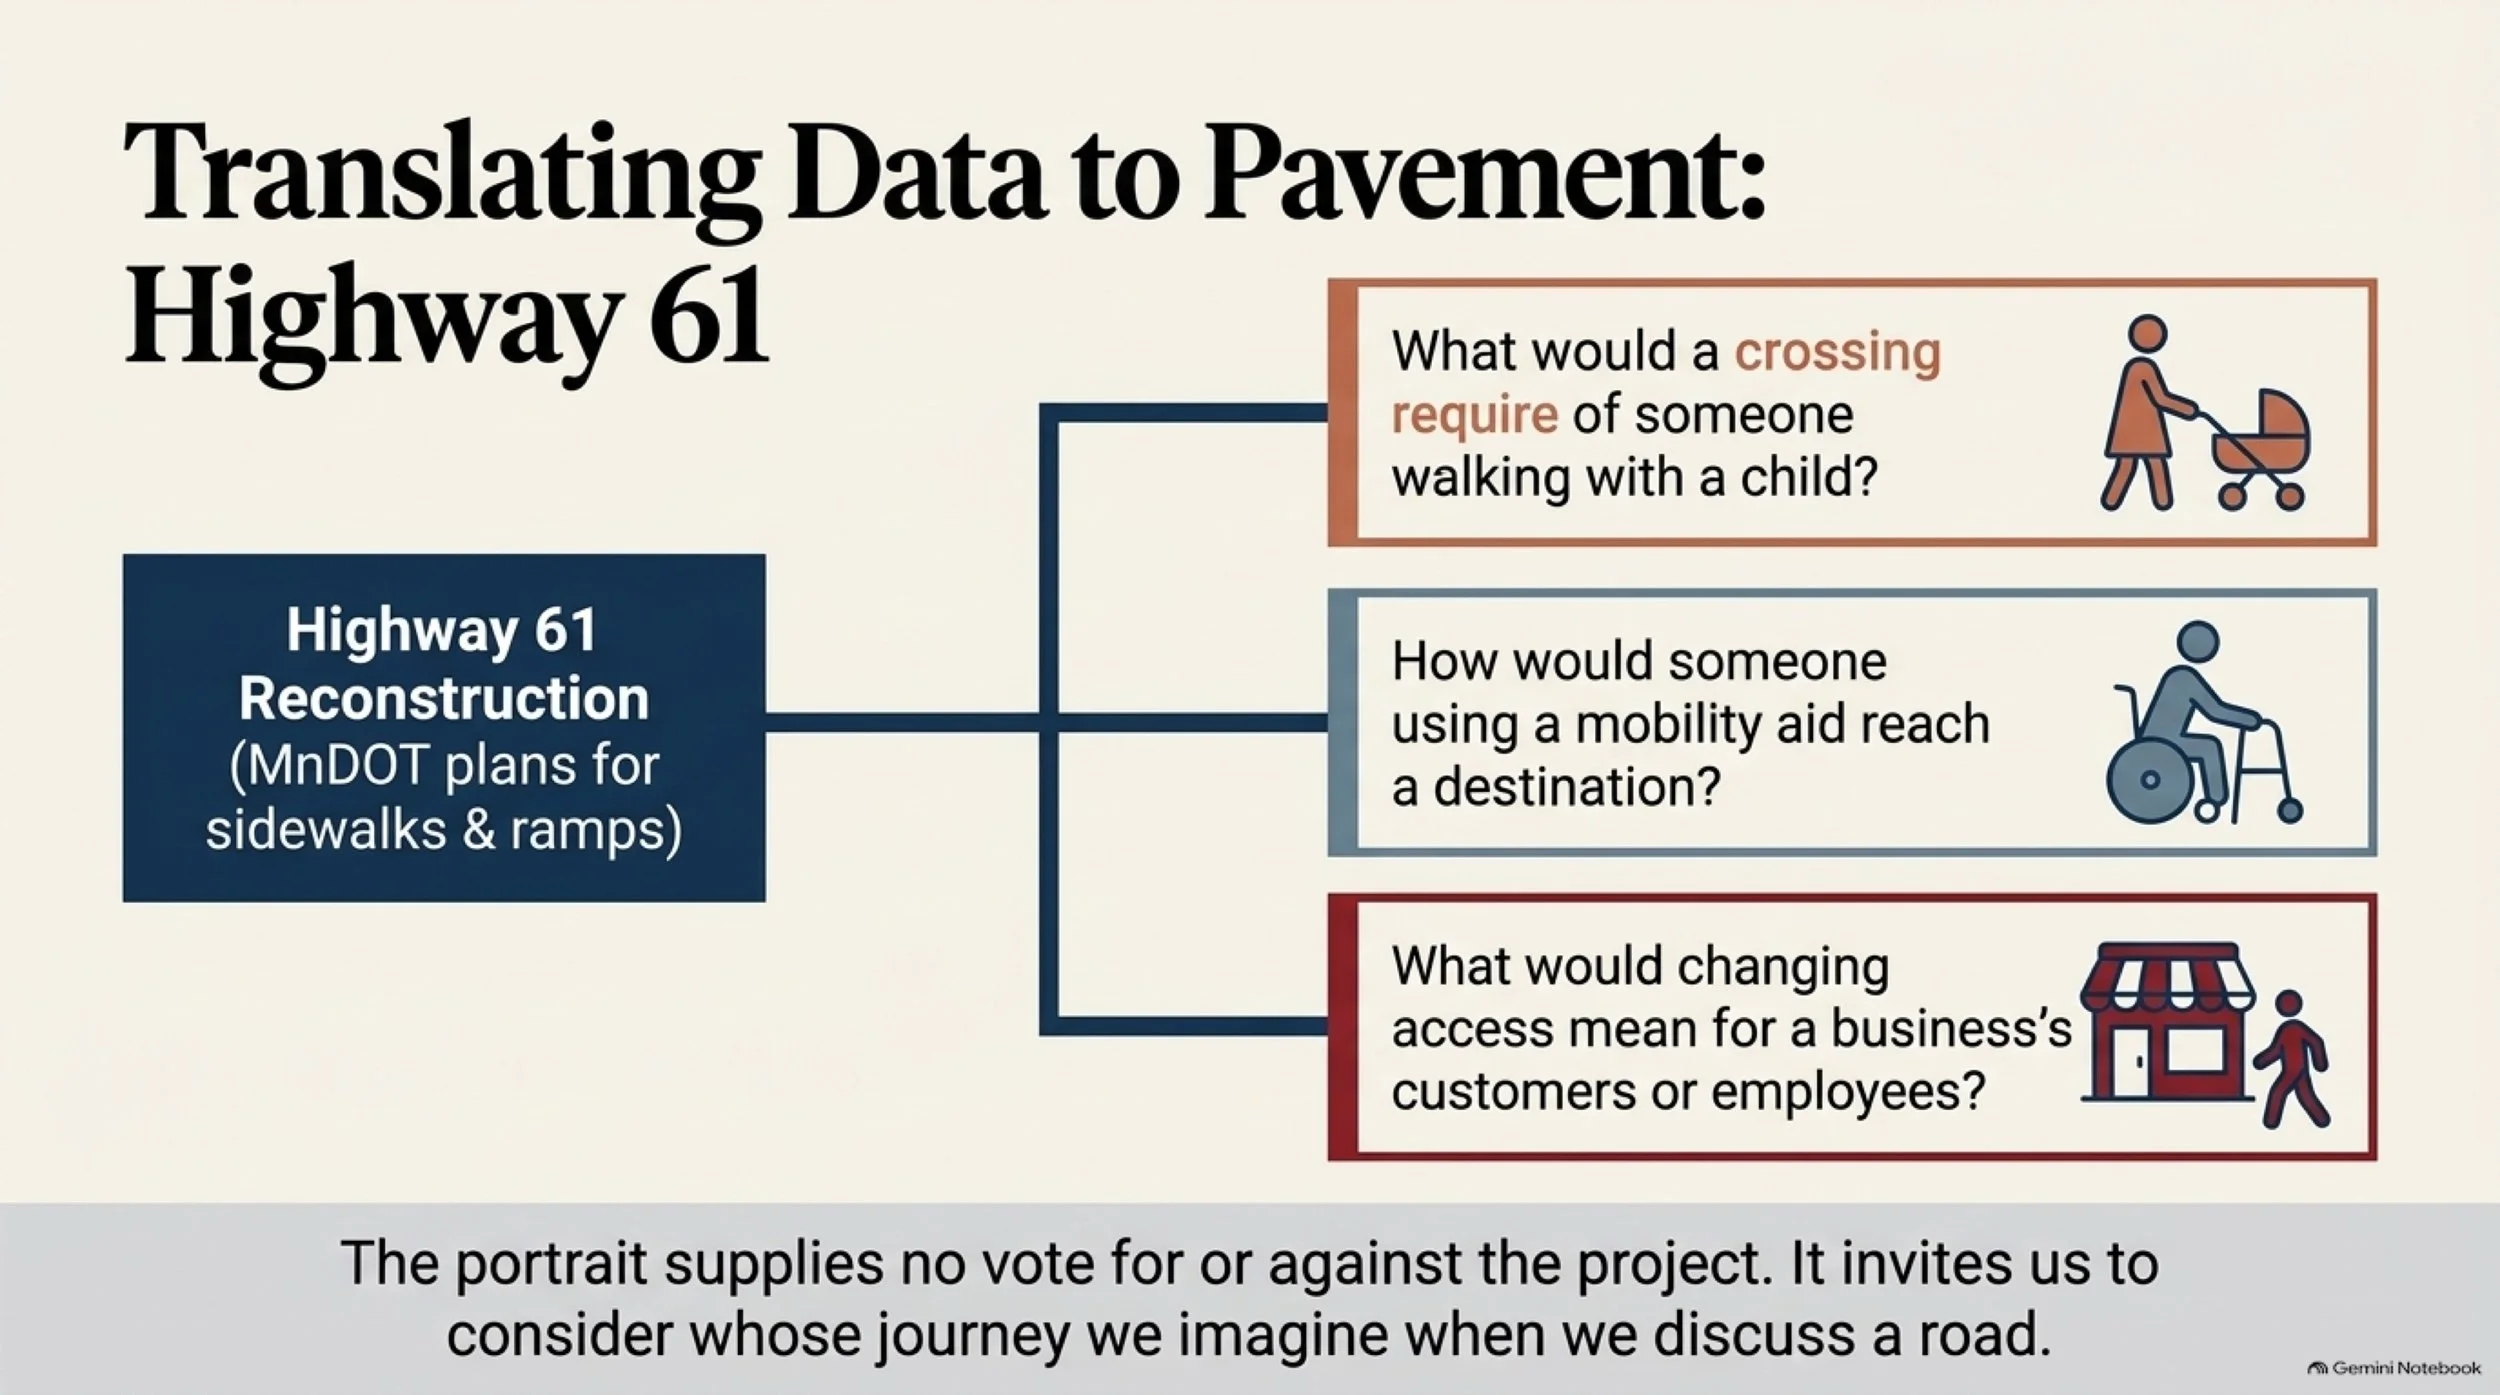
As of this edition’s October 15 cutoff, Hastings had scheduled an October 19 public hearing on proposed access and right-of-way changes for the Highway 61 reconstruction project. MnDOT’s plans include sidewalks, pedestrian ramps and accessibility improvements.
The hearing is still ahead of us in this edition. The proposed improvements are not yet measured outcomes.
The portrait supplies no vote for or against the project. It does invite us to consider whose journey we imagine when we discuss a road.
What would a crossing require of someone walking with a child? How would someone using a mobility aid reach a destination? What would changing access mean for a business’s customers or employees?
These are reporting questions. The people making those trips can help explain details that neither a demographic table nor a single figure can supply.
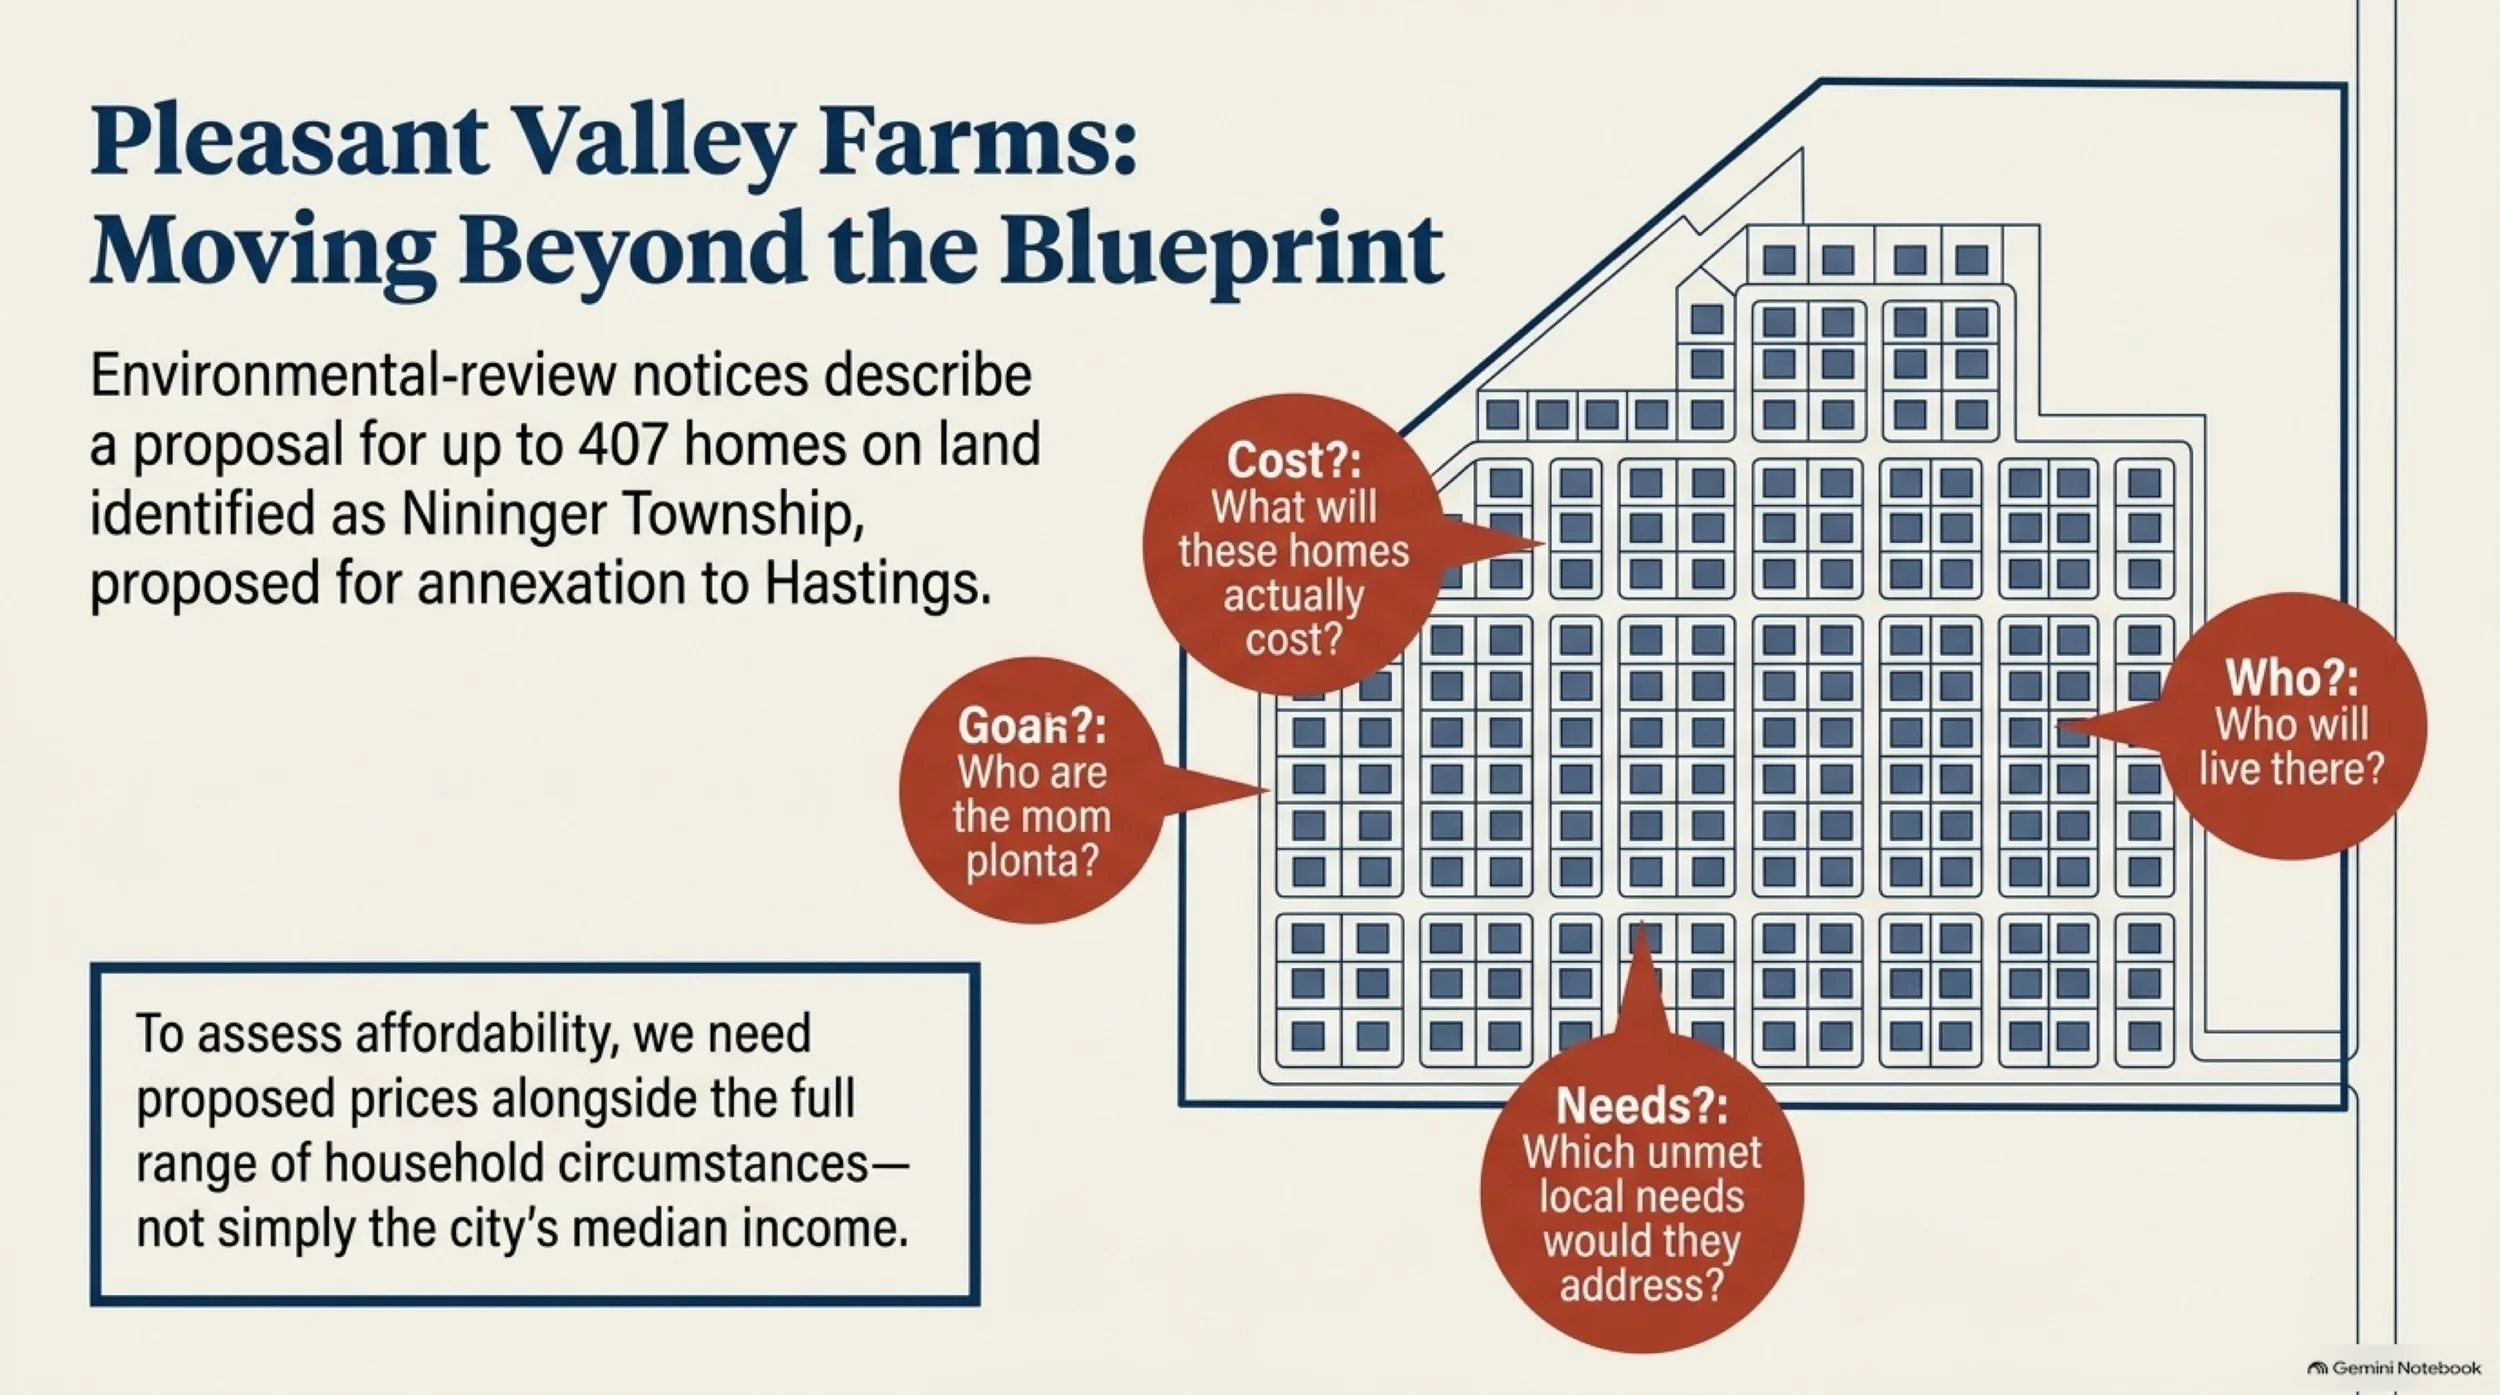
Housing raises a related question. Environmental-review notices describe Pleasant Valley Farms as a proposal for up to 407 homes on land identified as Nininger Township and proposed for annexation to Hastings. Those proposed homes and prospective residents cannot be counted as existing city households.
The proposed total cannot tell us what the homes would cost, who would live there or which unmet needs they would address. To assess affordability, we would need proposed prices and costs alongside the range of household circumstances—not simply the median income.
The larger question is useful beyond either project: Whose circumstances do we imagine when we make decisions about Hastings?
Demographic shares do not reveal officials’ intentions or predict residents’ opinions. Residents can help us understand the practical details by describing their own experience.
The space between the portrait and your life
Perhaps you recognize several of the reference’s traits. Perhaps almost none fit.
Either response can lead somewhere useful.
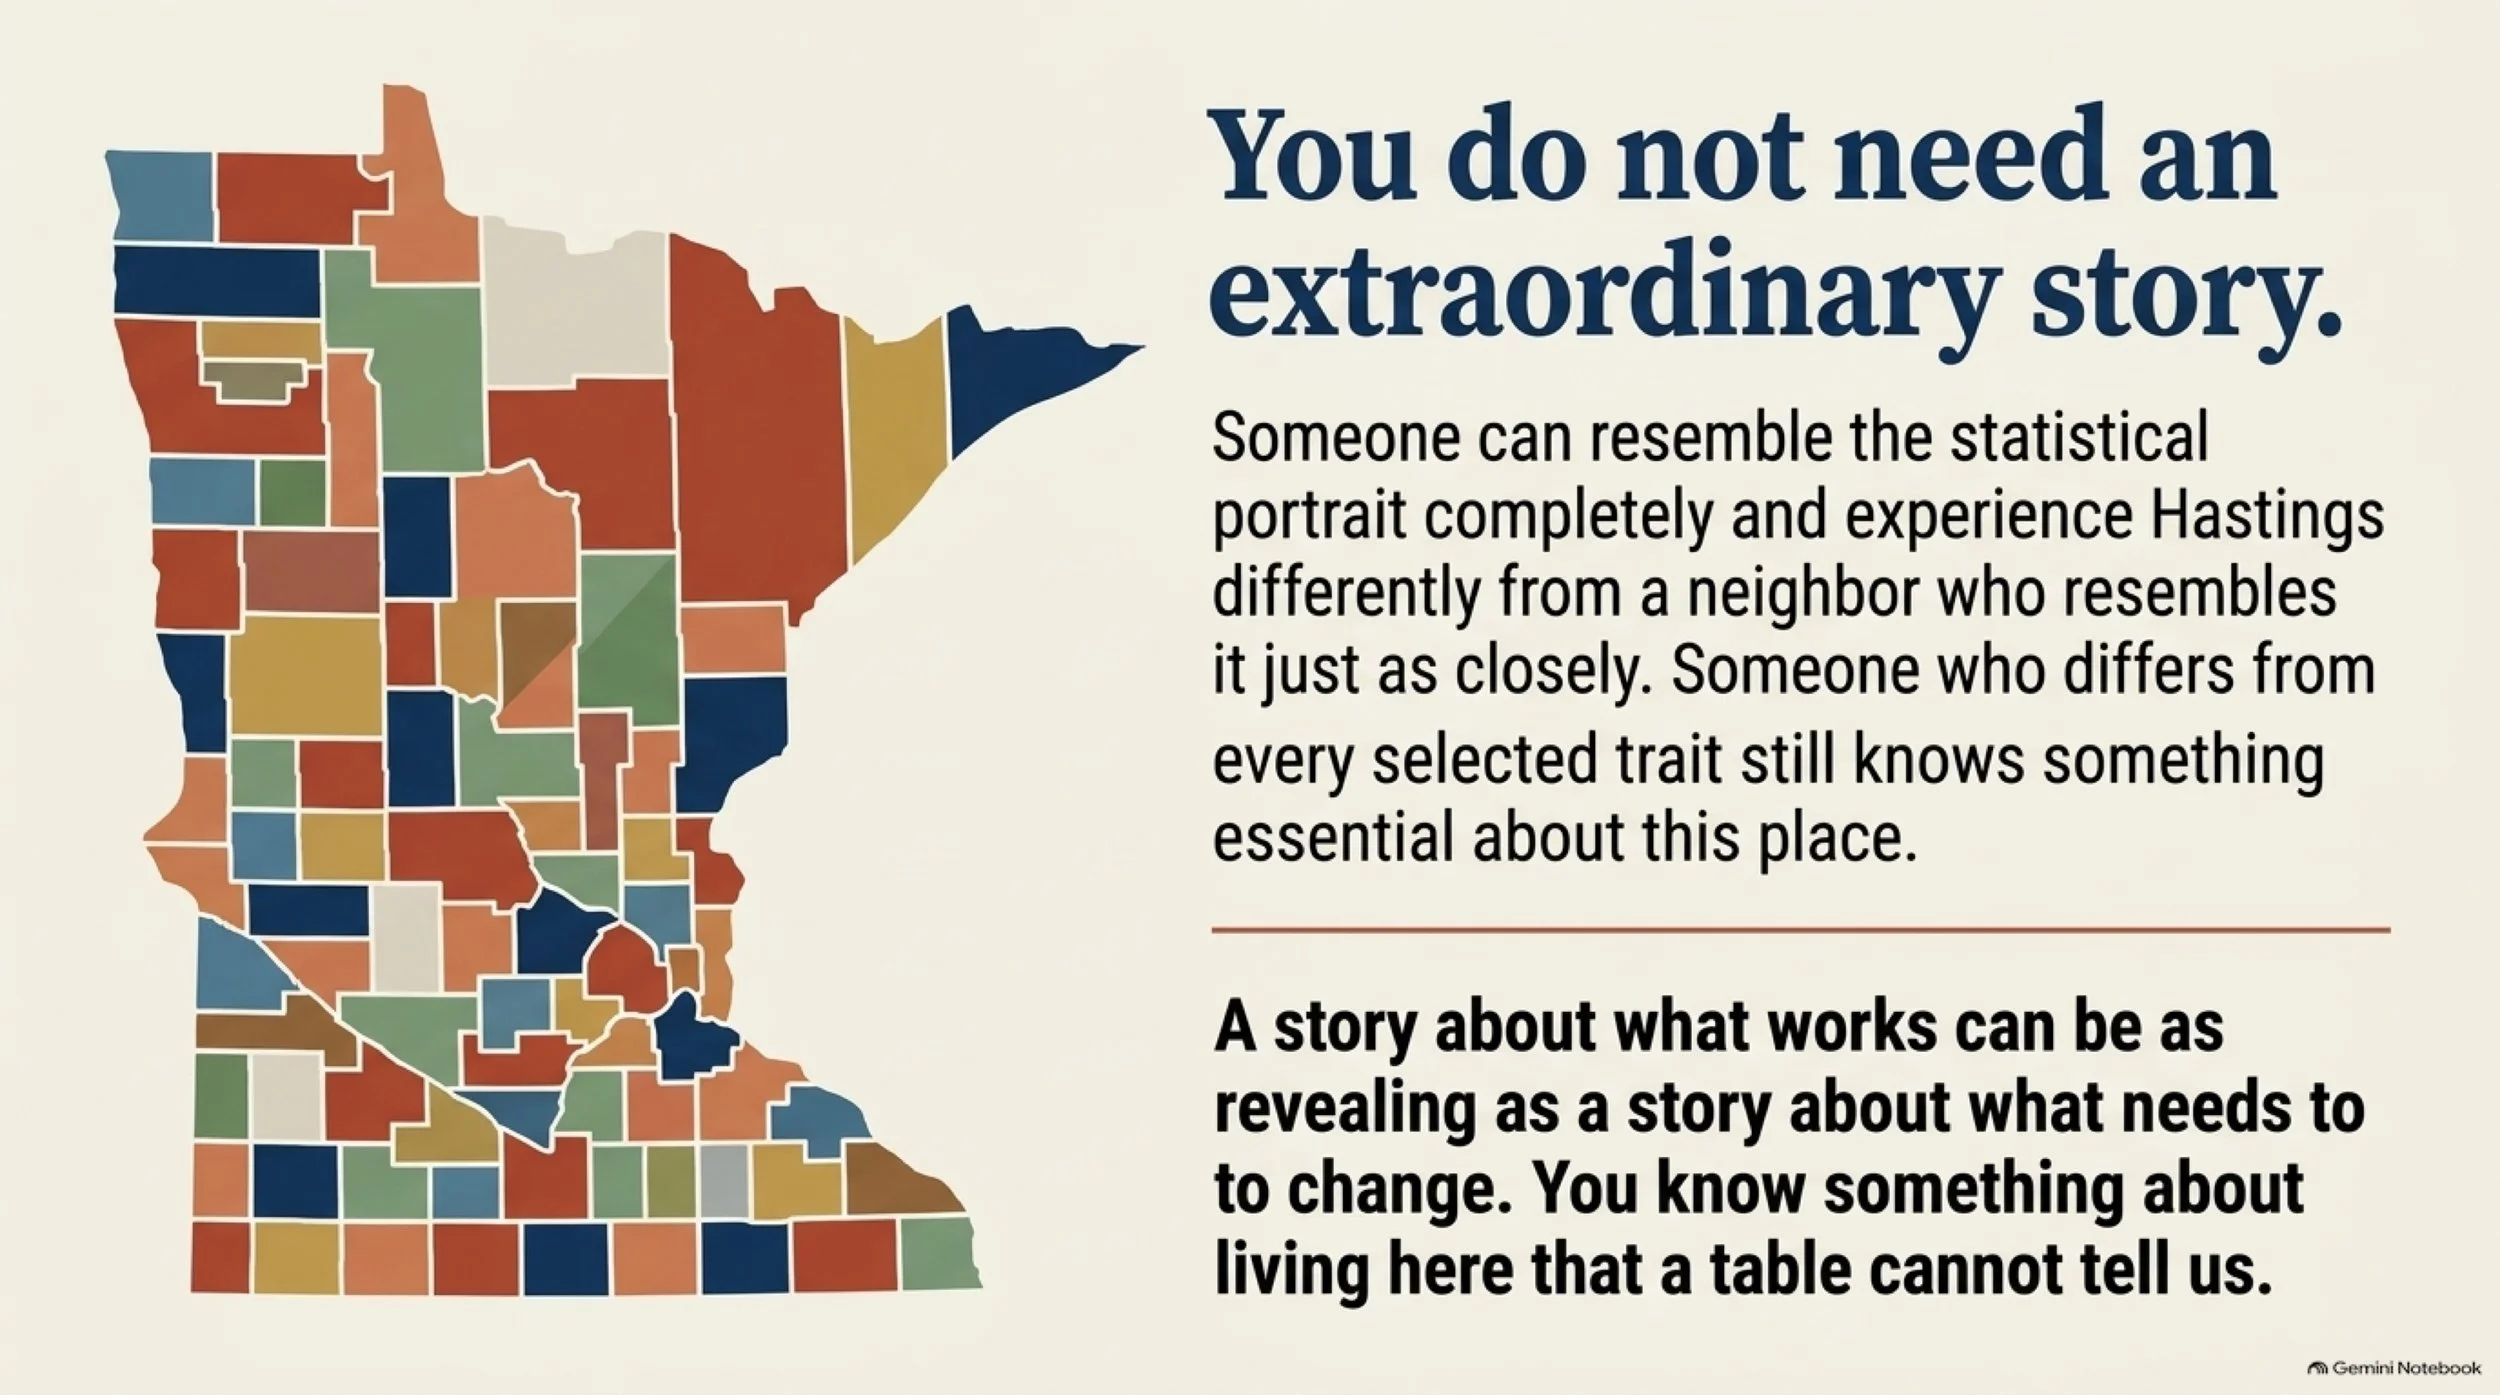
Someone can resemble the portrait statistically and experience Hastings very differently from another person who resembles it just as closely. Someone who differs from every selected trait can still know something essential about this place.
The most useful part of this portrait may be the space between it and your own life.
What does a table miss about the route you take, the hours you keep, the help you give or the information you struggle to find? What would someone understand differently if they spent an ordinary day alongside you?
These questions leave room for satisfaction as well as difficulty. A story about what works can be as revealing as a story about what needs to change. Neither requires someone to stand for an entire age group, neighborhood or housing category.
This edition does not include resident interviews or assign the figure their voices. The next layer of understanding would have to come from listening, checking what can be checked and letting experiences remain more complicated than a convenient description.
How this portrait was made
This independent editorial project uses the Census Bureau’s 2020–2024 American Community Survey five-year estimates, released January 29, 2026. October 2026 identifies the edition; the evidence cutoff is October 15, 2026.
The statistics describe Hastings city, Minnesota, using the January 1, 2024 boundaries for this release. They do not describe the entire postal area or school district. Age, sex, race and the housing reference include all residents; education covers adults 25 and older. Income and earnings retain their separate household and person definitions.
Age uses a published median. Education uses the category containing the ordered midpoint. Sex and race-and-ethnicity use the largest respective categories. Housing selects the largest of three all-resident groups: owner-occupied housing, renter-occupied housing and group quarters.
These are editorial selection rules. The tables do not establish their joint prevalence, and no probability of matching the whole figure was calculated. Percentages are rounded.
The figures are survey estimates. At the 90% level, the male share has a calculated margin of about ±1.7 percentage points, the White-alone/non-Hispanic share ±2.8 points, and the owner-housing resident share an approximate ±2.5 points. Separate checks of the cumulative education shares support the selected estimated median category. Sampling margins do not cover every possible error.
AI assisted the research, calculations and writing; the portrait illustration is AI-generated editorial artwork. Original-source and arithmetic checks were performed, but AI review is not a substitute for human source checking or a guarantee of accuracy. The illustration’s appearance is an artistic choice.
[EDITORIAL PLACEHOLDER: Add reader-accessible links to the full methodology and source ledger before publication.]
Add your part to the picture
What does this portrait miss about your experience of living in Hastings?
Send a response or correction to info@HastingsNow.com, the address listed on our contact page. You can also suggest what a future Living Portrait should investigate.
HastingsNow is operated by Local Pigeon, LLC. We want residents’ knowledge to help identify questions for further reporting. Responses may help shape that work; they will be personal perspectives, not a representative survey.
Tell us whether we may contact you. We will seek permission before identifying or quoting you. You do not need to disclose your income, race, religion or other sensitive details to take part.
You do not need a following. You do not need an extraordinary story. You know something about living here that a table cannot tell us.
The mirror gives us a place to begin. What we learn next depends on what we are willing to notice—and what we make room to hear.