
What Hastings Loves—and What Could Make Life Here Better
The Living Portrait, Part Two: What the 2020 and 2024 community surveys reveal about the place we share.
HastingsNow | Document-based analysis | Prepared October 19, 2026
What would you miss about Hastings if you had to leave?
A familiar walking route? A library visit? A place to meet someone? Something so ordinary that you rarely think to call it part of your quality of life?
Now consider a second question: What would make an ordinary week here easier?
Your answers do not have to contradict each other. You do not have to choose between appreciating Hastings and wanting it to work better.
The community surveys give that conversation somewhere to begin. In spring 2024, public library services received a 94% excellent-or-good rating, and the availability of paths and walking trails received 90%. Meanwhile, evaluations of cost of living were less favorable than in fall 2020. These are historical survey findings, not measurements of what residents think today. (2024 NCS report, printed pp. 24, 21 and 12; Q9, Q7 and Q6.)
In Part One, “If Hastings Looked in the Mirror, Who Would Look Back?”, we introduced one fictional community reference assembled from separate population statistics. The roughly 41-year-old figure was a starting point for understanding Hastings—not a person who could speak for everyone. This chapter leaves that reference intact and looks more closely at the community around it.
The purpose is not to give the figure opinions. It is to notice where a shared picture helps—and where we need to hear from the people it cannot fully describe.
A city is more than its most dramatic changes
Before following the biggest increases and decreases, consider the less dramatic finding: most comparable evaluations were not classified as changing significantly.
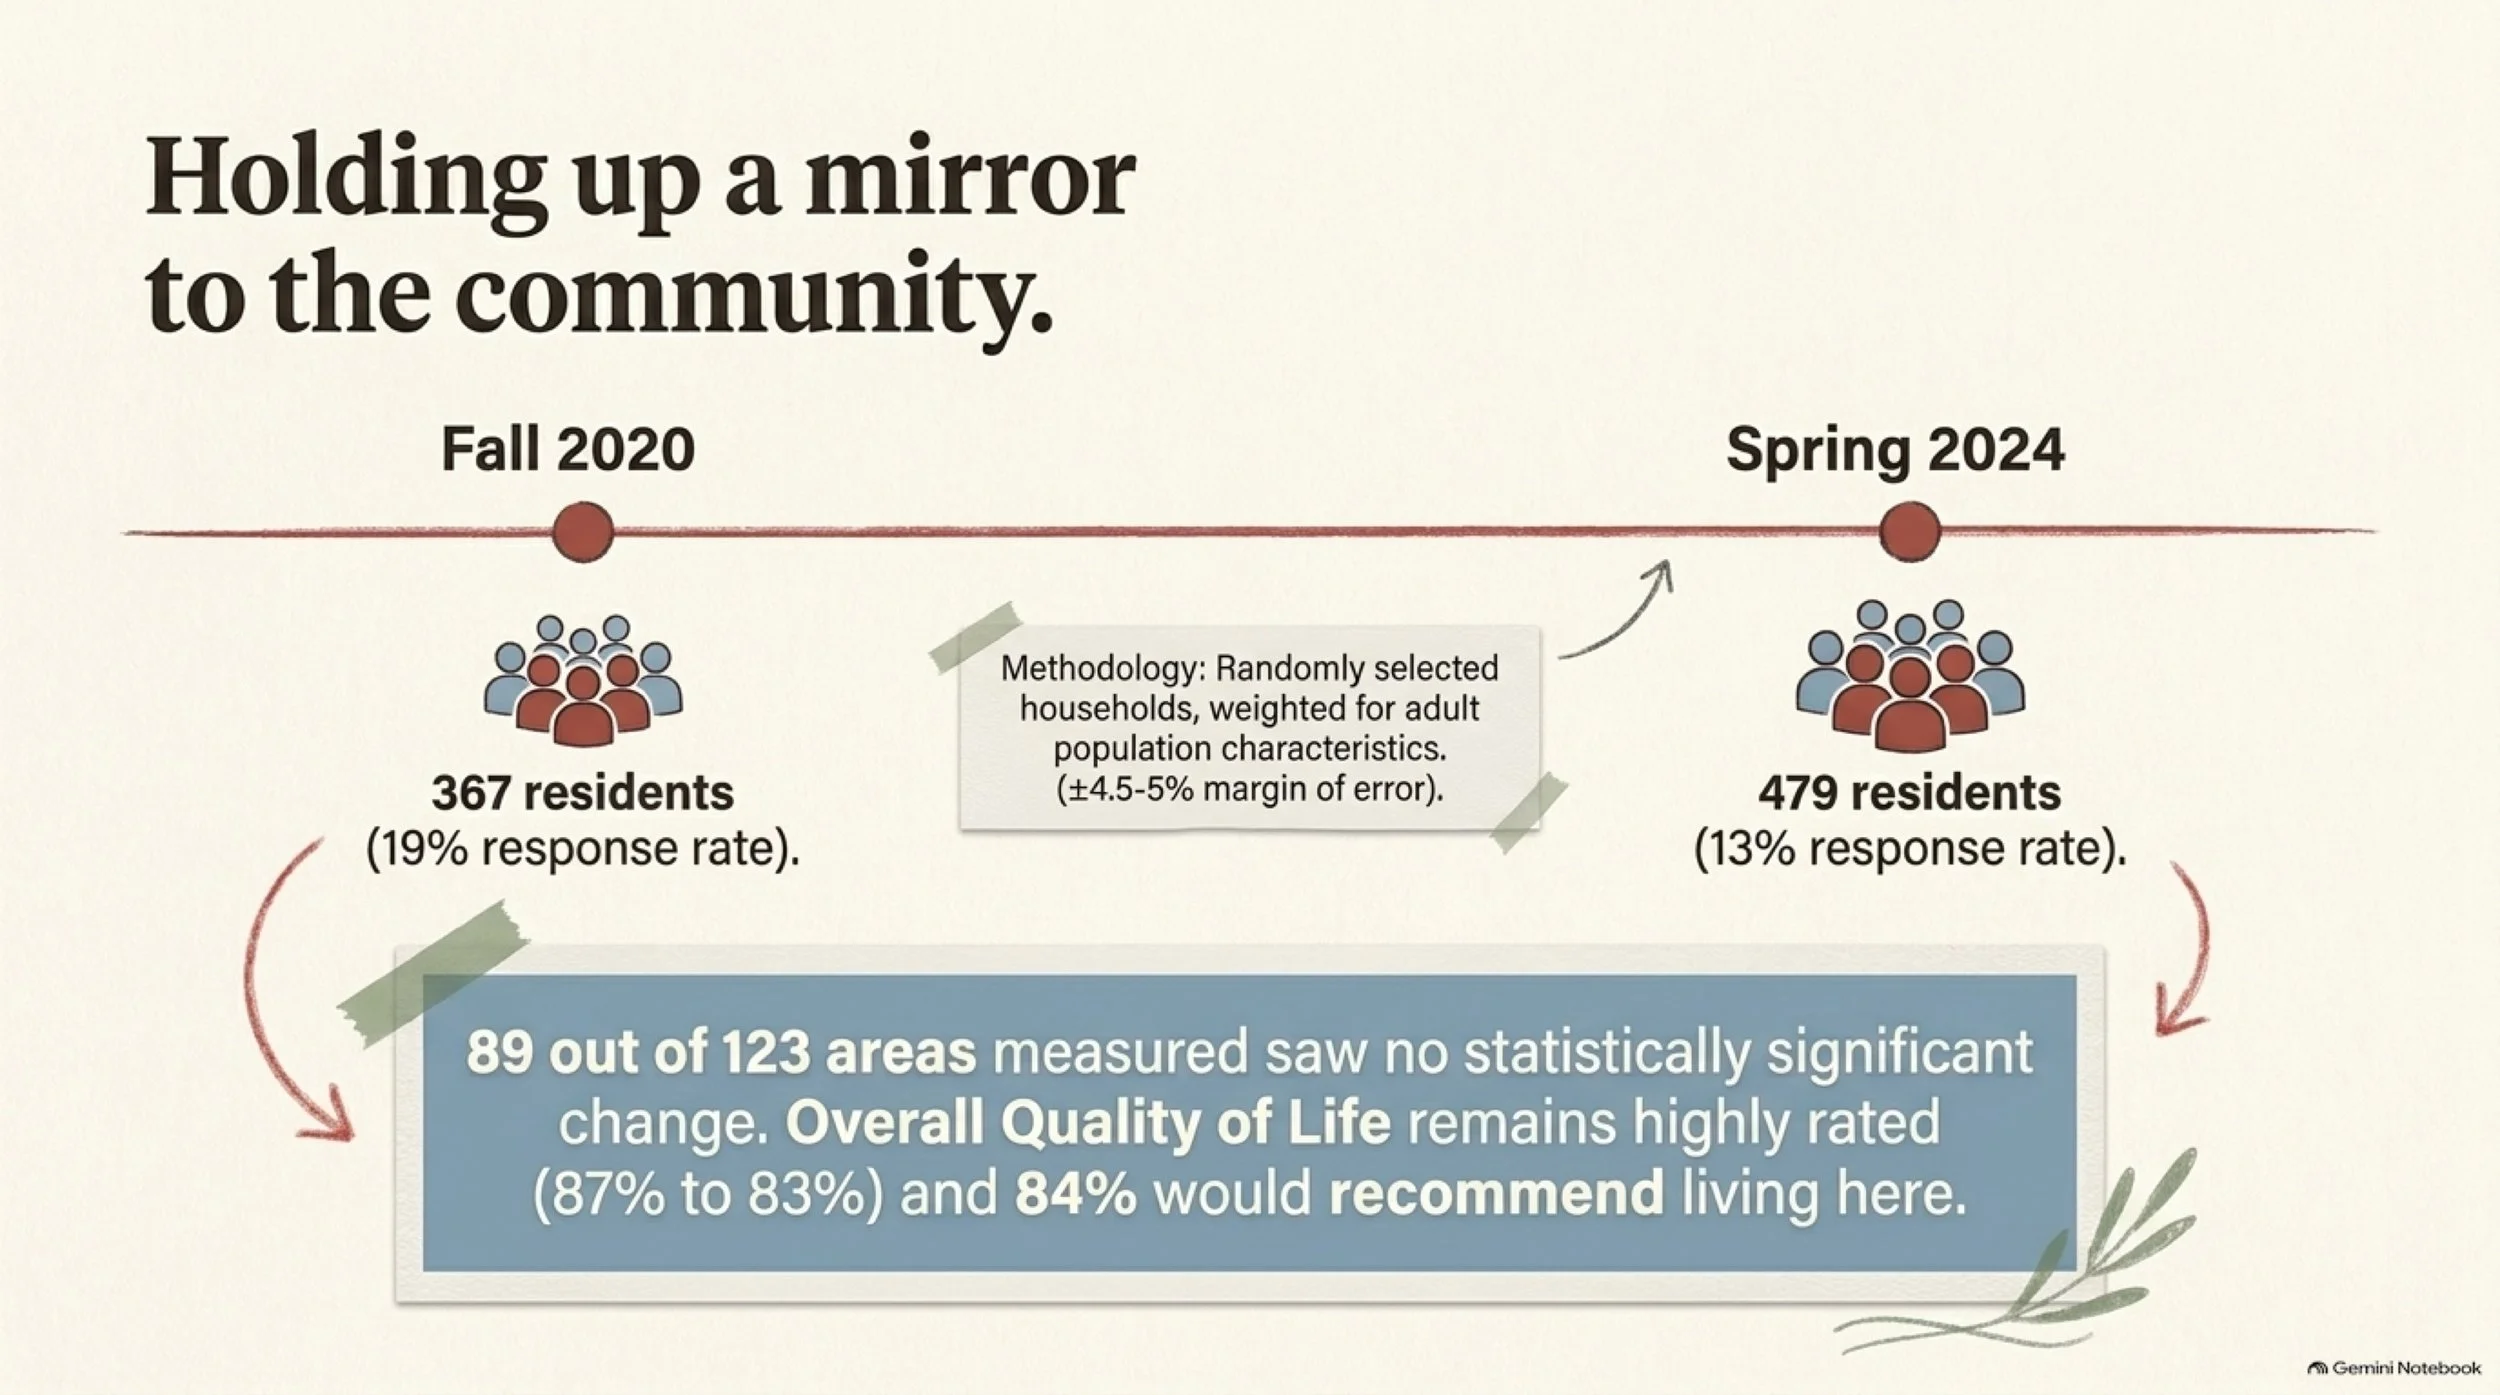
The 2024 report identifies 89 of 123 comparable evaluative questions as statistically similar to the 2020 results, with 20 increasing and 14 decreasing. That does not prove nothing changed in those 89 areas. It means the report did not classify their differences as statistically significant. (2024 NCS report, printed p. 6, “Key Findings.”)
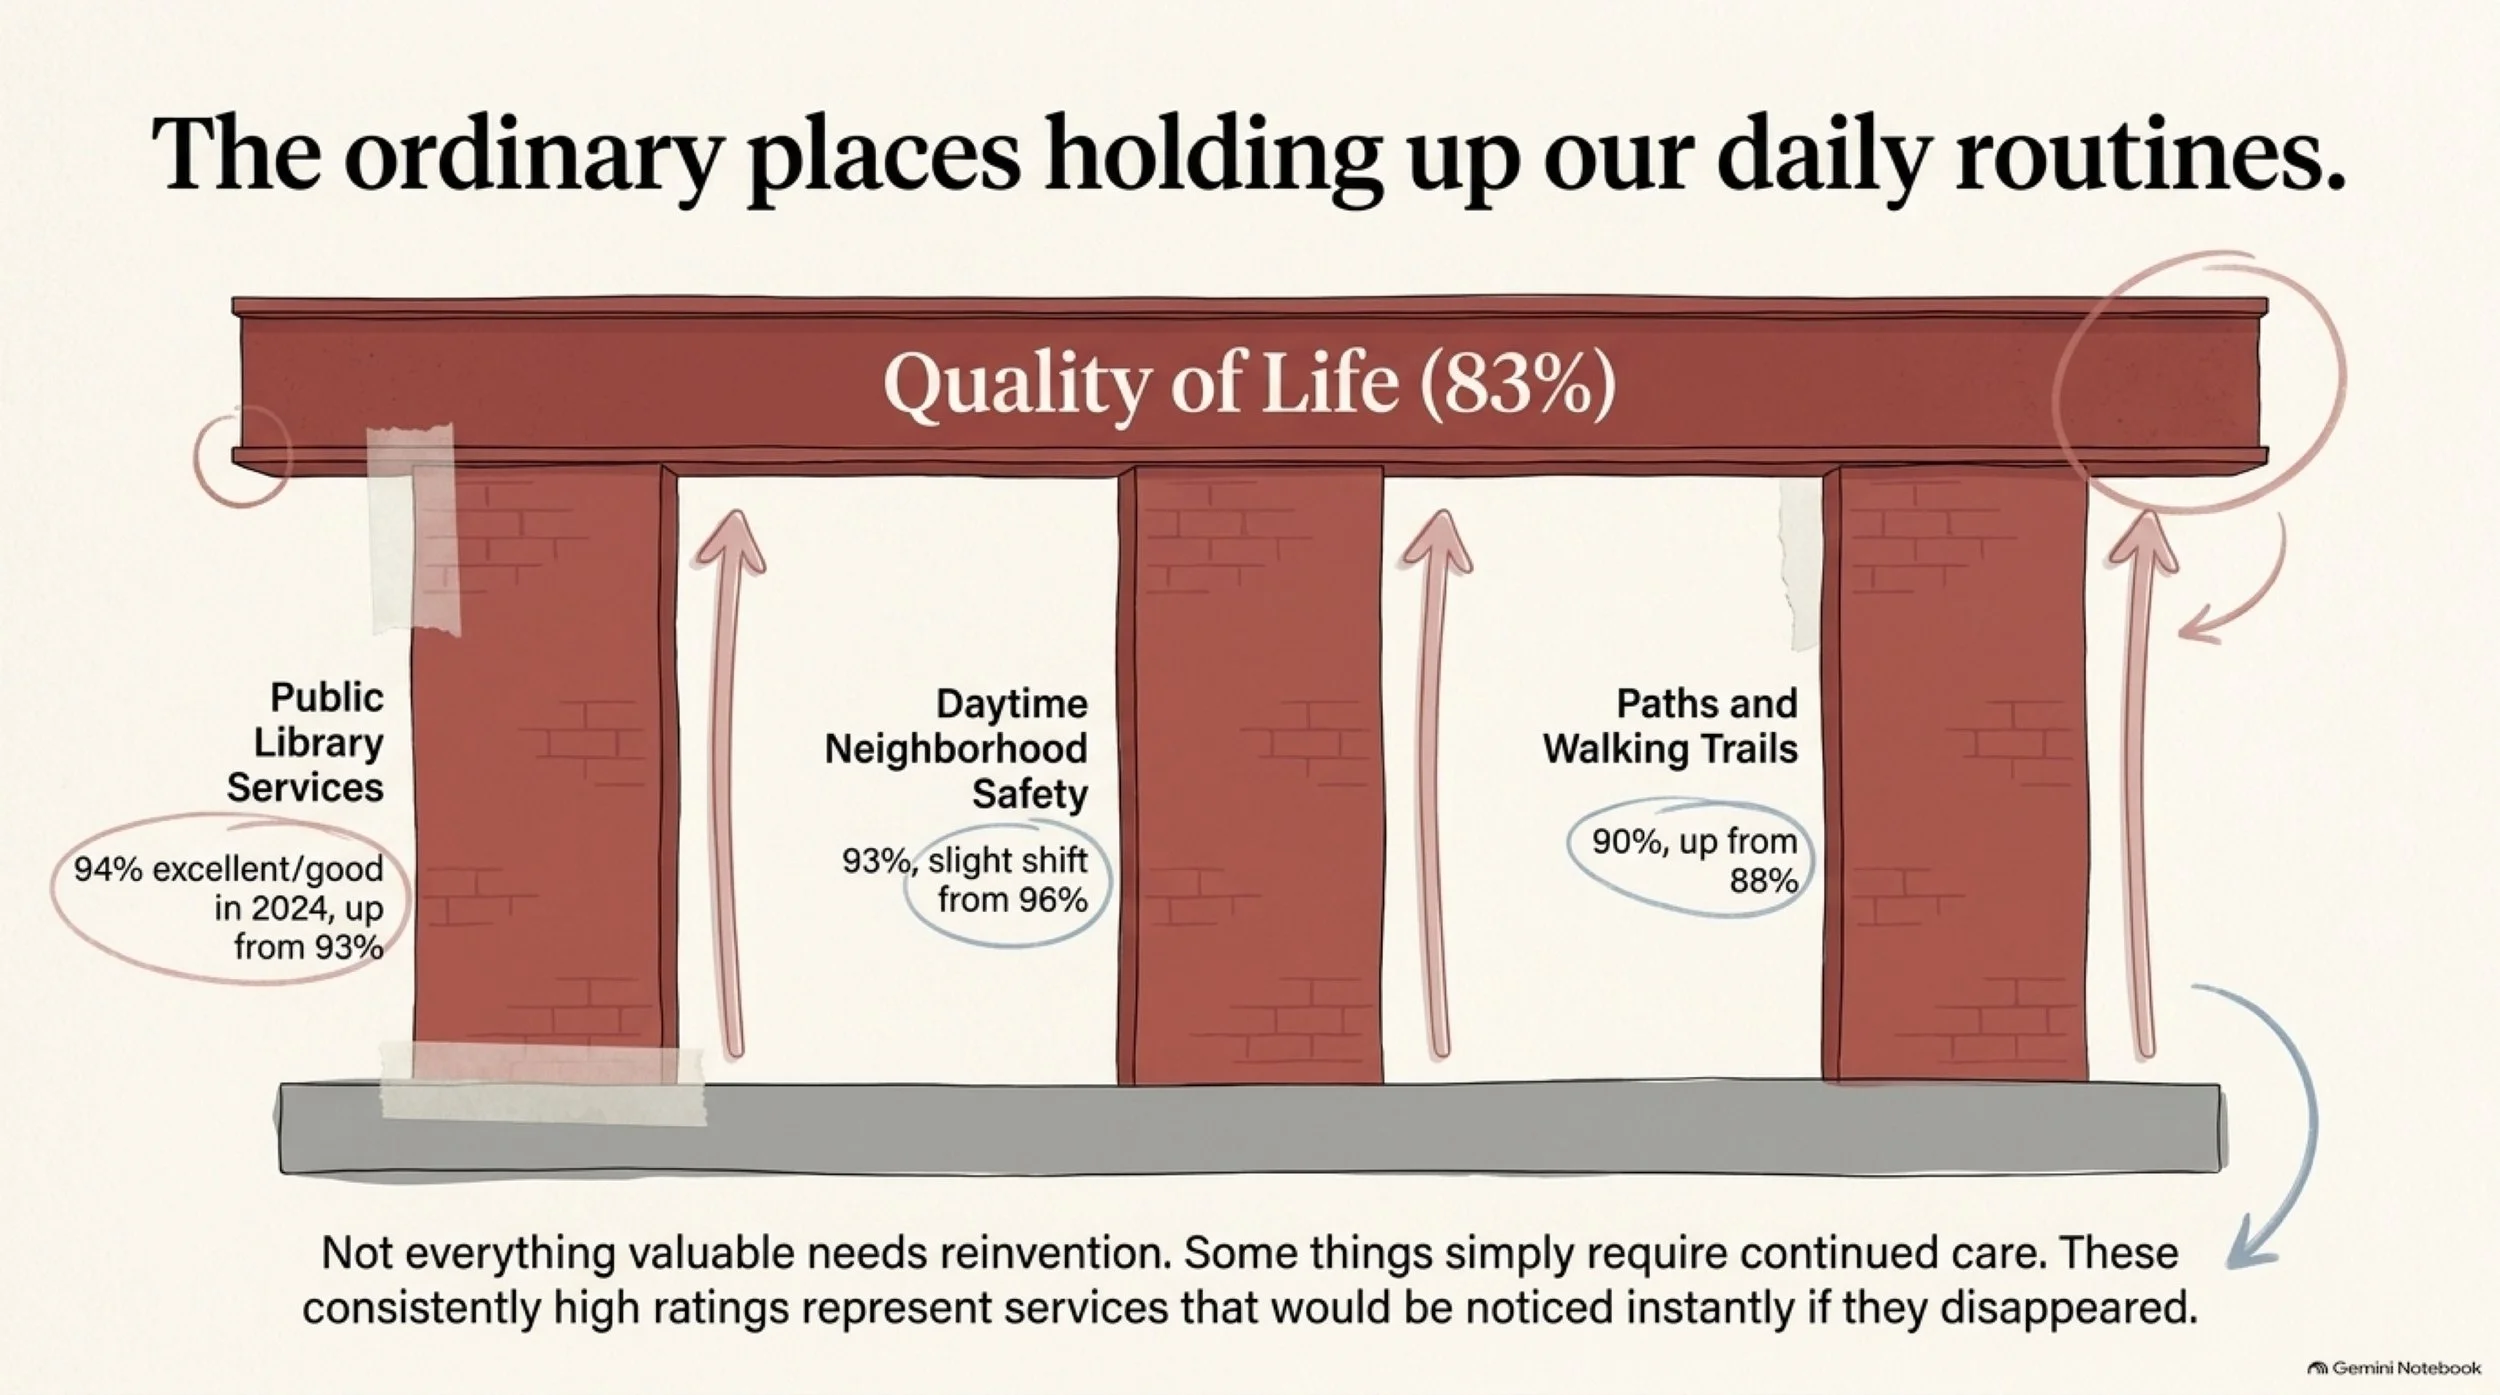
Overall quality of life received an excellent-or-good rating of 87% in 2020 and 83% in 2024. A separate question found 86% and 84%, respectively, very or somewhat likely to recommend living in Hastings. Neither difference exceeds the report’s stated seven-percentage-point threshold for a significant change. (2024 NCS report, printed pp. 8 and 2; Q1, Q3 and trend methods.)
Those favorable assessments belong near the beginning of the story, not buried after the concerns. So does the fact that they were not unanimous.
A community can receive strong overall evaluations while particular parts of life deserve closer attention. Reading only the highest ratings would miss the difficulties. Reading only the declines would miss what people evaluated favorably in the first place.
The everyday places worth noticing
The library and trail findings are striking partly because they were already strong.
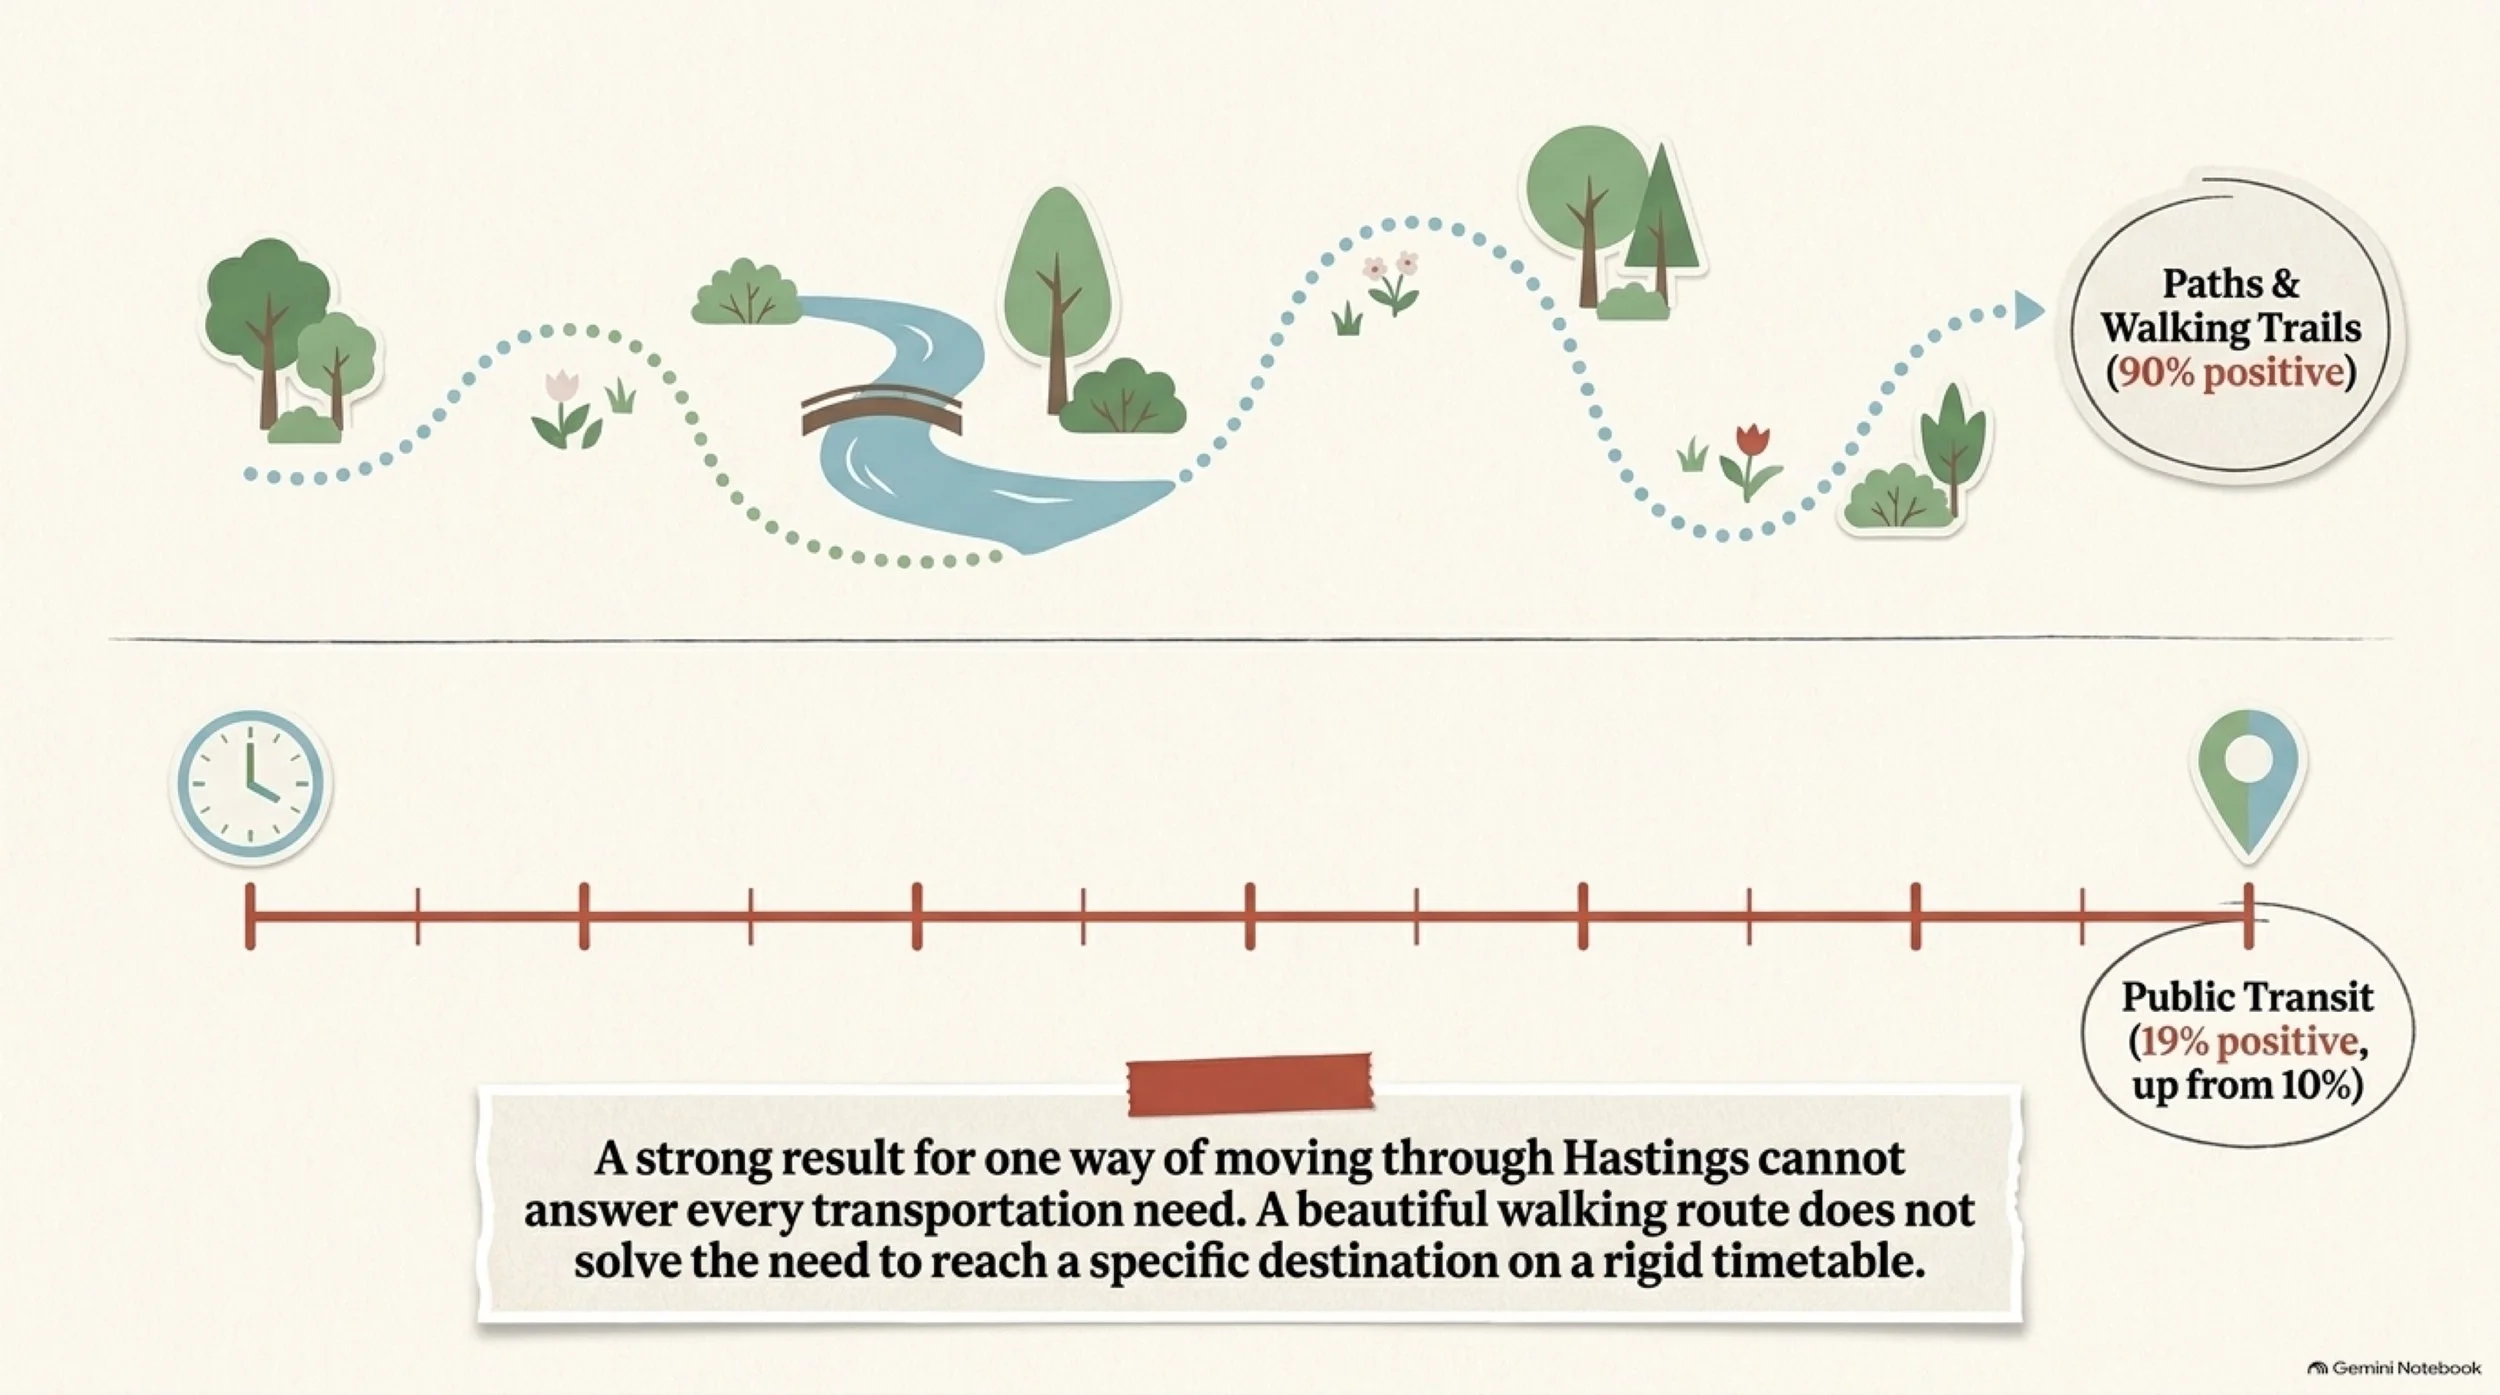
Public library services received 93% positive ratings in 2020 and 94% in 2024. Availability of paths and walking trails received 88% and 90%. The small differences are less important here than the consistently favorable evaluations. Polco classified the 2024 trail-availability rating as much higher than its national benchmark. That is a comparison of survey ratings, not an independent ranking of every trail system in the country. (2020 NCS report, PDF pp. 24 and 22; 2024 NCS report, printed pp. 24 and 21; Q9 and Q7.)
Try thinking about those findings through your own ordinary week. Which places let you do something you value? Which services would become noticeable very quickly if they were harder to reach, less reliable, or unavailable?
The survey cannot answer those questions for you. Nor does a high rating establish that everyone uses a service or finds it equally accessible. But it suggests a useful way to think about improvement: not everything valuable needs reinvention. Some things need continued care.
Perceived daytime neighborhood safety also received high marks: 96% in 2020 and 93% in 2024 felt very or somewhat safe in their neighborhood during the day. The three-point difference is below the report’s change threshold. These figures concern a specific feeling in a specific setting; they are not crime rates or nighttime-safety results. (2020 NCS report, PDF p. 19; 2024 NCS report, printed p. 18; Q4.)
A strong community-wide result should not make a different individual experience harder to hear. Someone who cannot use a well-rated amenity, or who feels less safe than the prevailing assessment suggests, may identify something important to investigate.
The useful response is neither to dismiss the favorable result nor to dismiss that person. It is to understand what each can tell us.
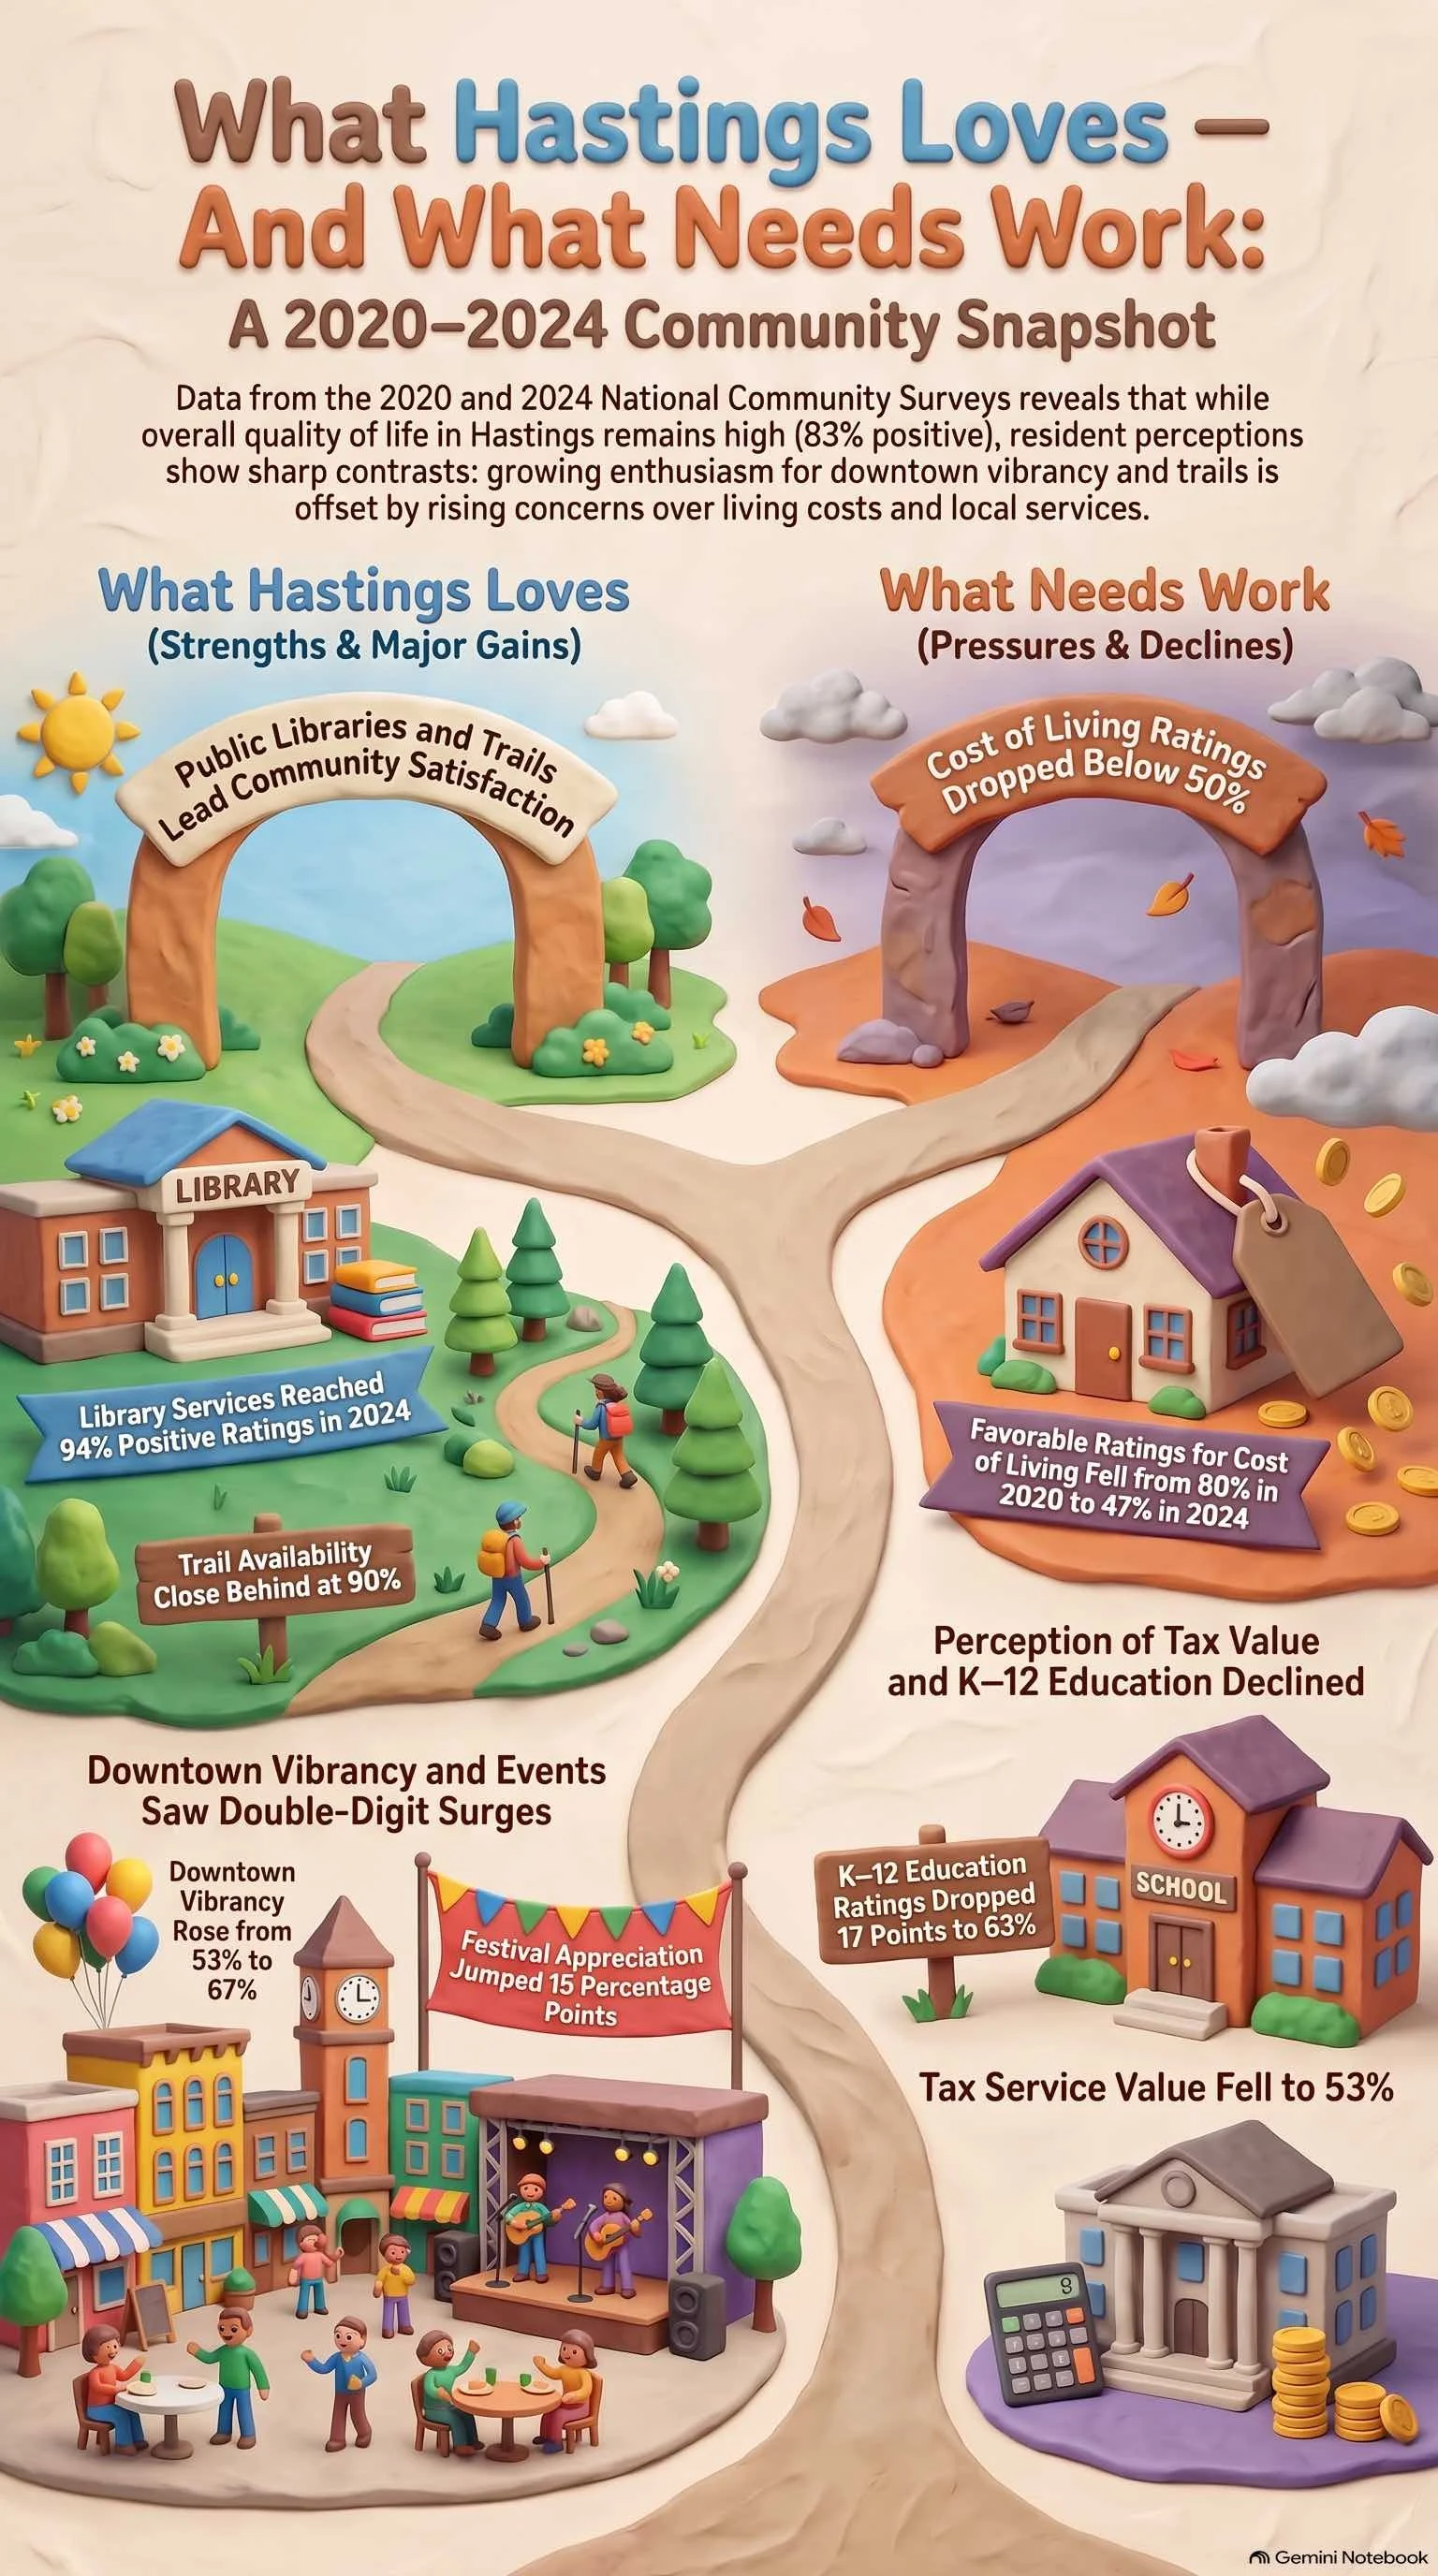
Community Snapshot Infographic by HastingsNow.com
A brighter assessment of downtown—with room still to improve
The surveys recorded a different pattern in several business and event questions: substantial increases in positive ratings.
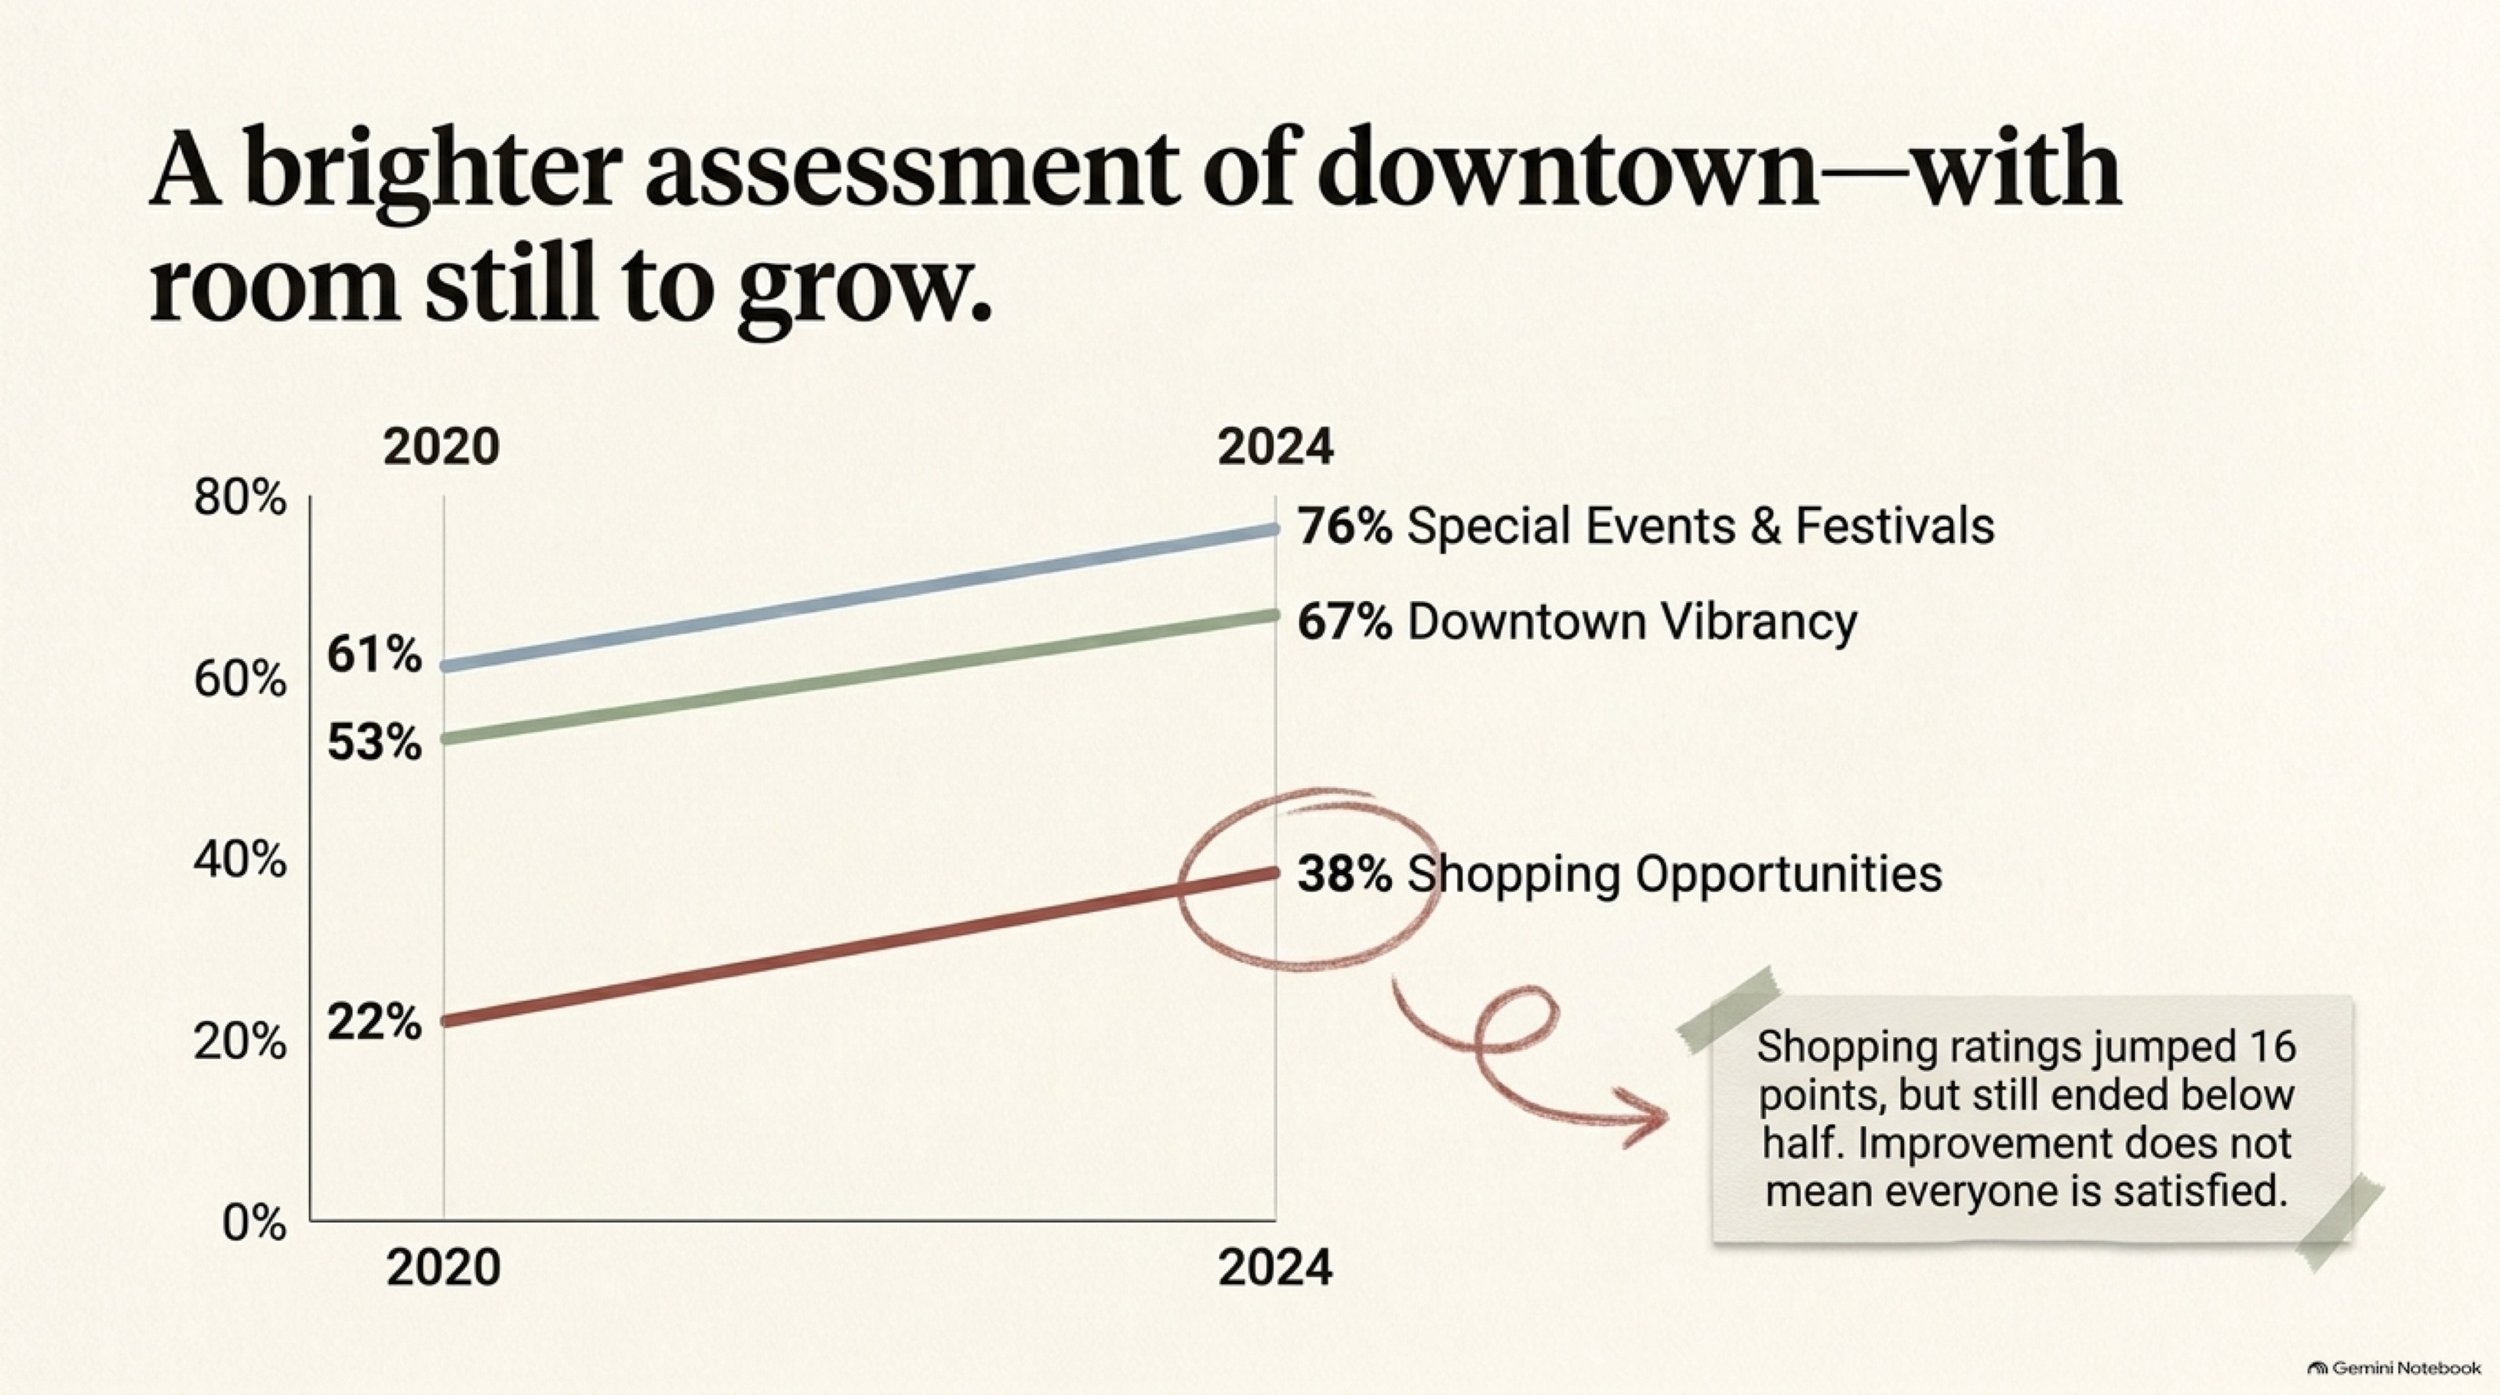
Vibrancy of the downtown/commercial area rose from 53% in 2020 to 67% in 2024. Shopping opportunities rose from 22% to 38%. The 2024 report highlights both increases. Its shopping question concerns shopping—not a combined assessment of shopping and dining. (2020 NCS report, PDF p. 12; 2024 NCS report, printed pp. 12 and 6; Q6.)
Opportunities to attend special events and festivals increased from 61% to 76%. That is a fifteen-percentage-point increase in favorable evaluations, not evidence that fifteen percent more events occurred. (2020 NCS report, PDF p. 24; 2024 NCS report, printed p. 23; Q7.)
These findings provide something worth recognizing without requiring an invented explanation. The reports do not identify which business, organizer, investment, or change in expectations produced the higher ratings. Giving a particular person or policy credit would require further evidence.
The starting and ending points are revealing, too. Shopping ratings increased sixteen points but still ended below half. Improvement did not mean everyone was satisfied.
That makes a more useful conversation possible than simply declaring success or failure. What became easier to find? What remained missing? A resident’s specific answer could help explain a broad rating far better than assuming that all lower ratings mean the same thing.
The same approach applies to events. A calendar can be evaluated favorably while leaving practical questions about timing, cost, access, and information. These are questions to investigate—not barriers the survey has established for particular residents.
We can recognize the stronger evaluations and remain curious about what they leave unresolved.
Enjoying a place and affording life there are different questions
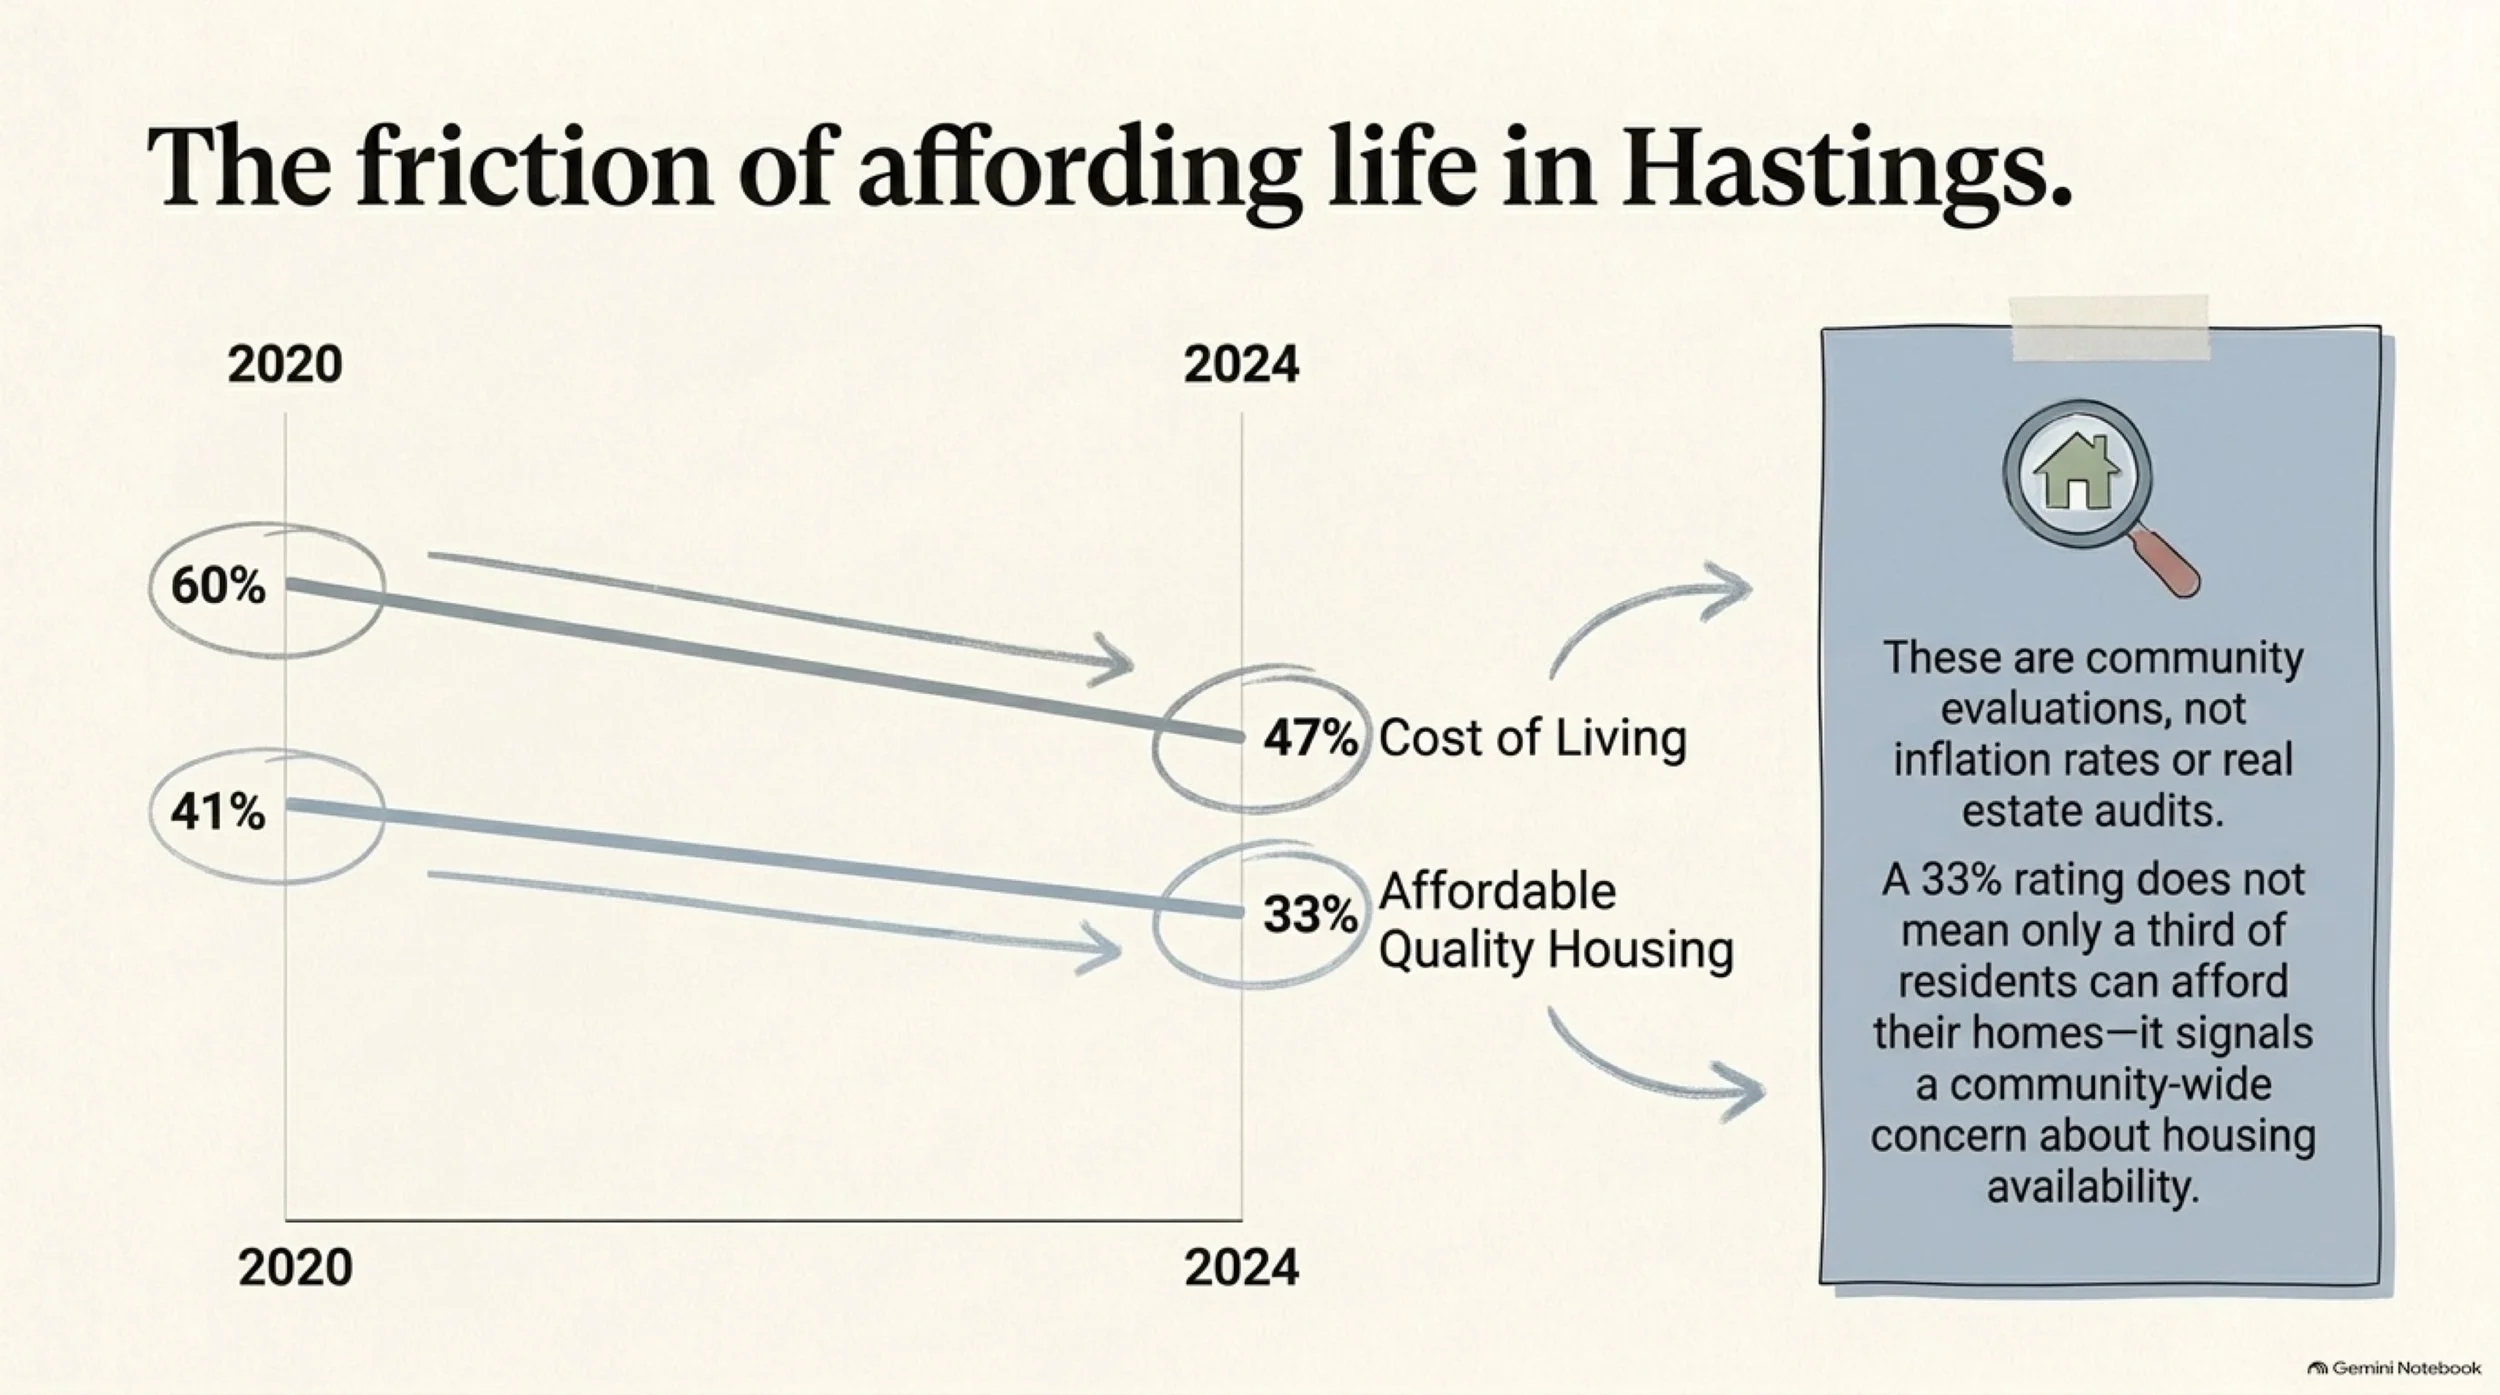
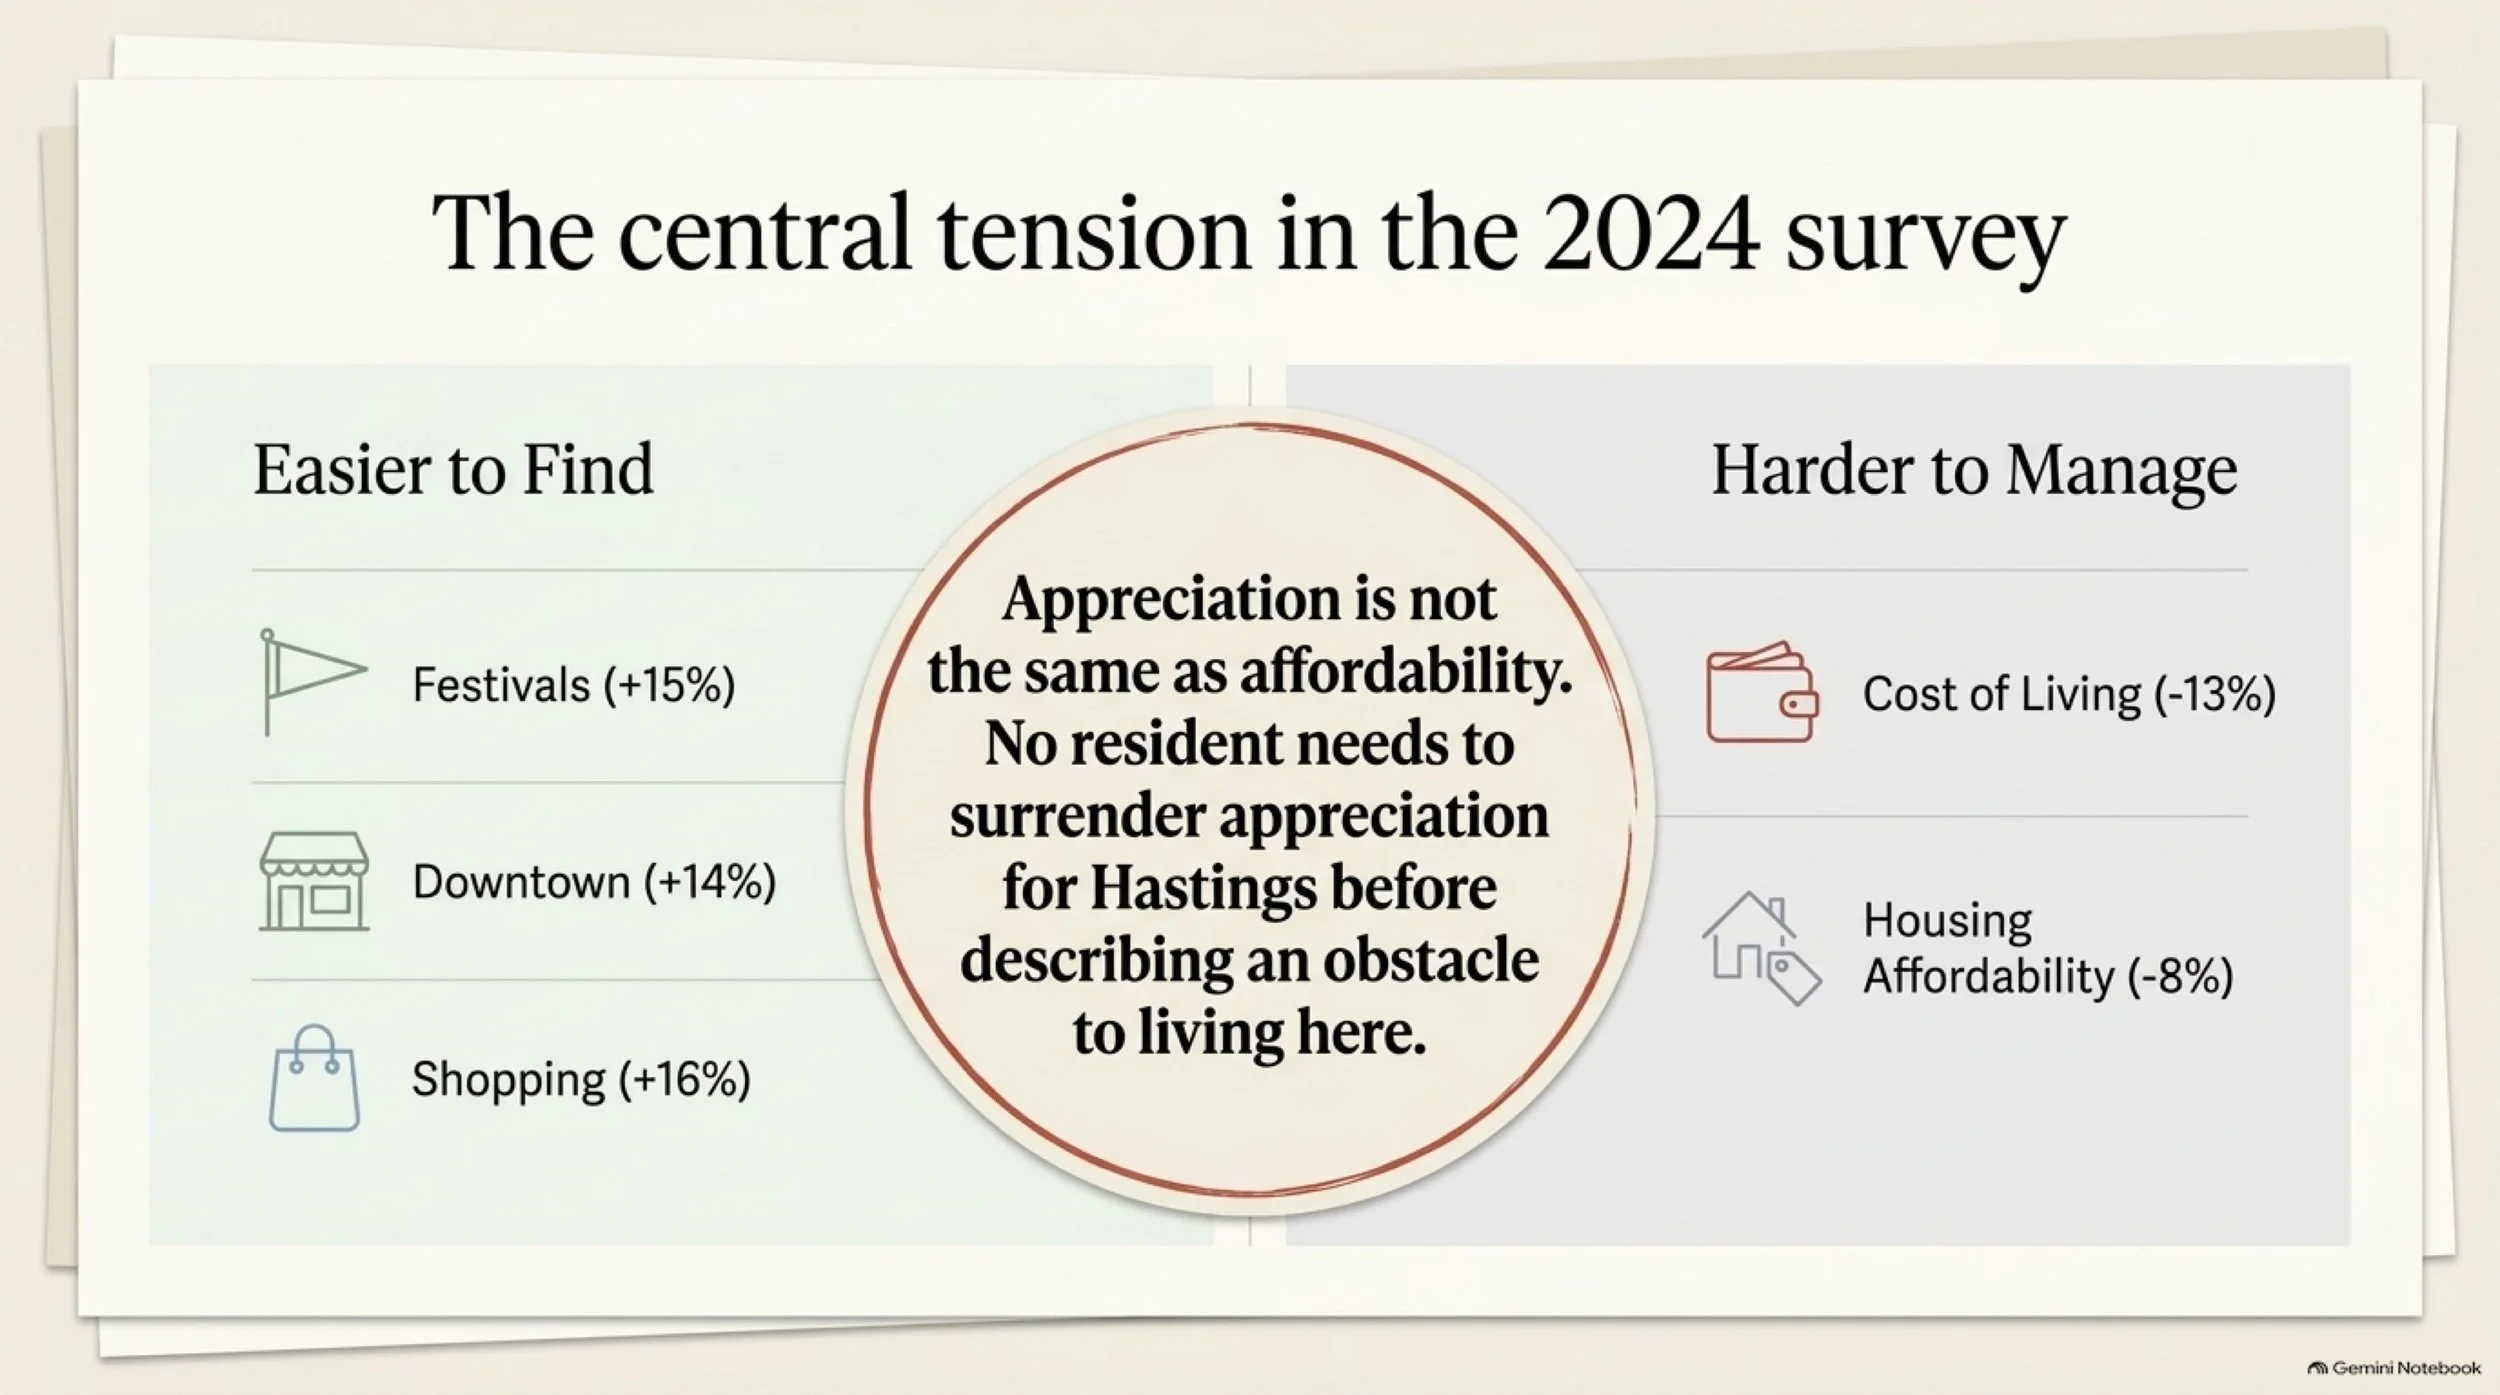
On the same page where the 2024 report shows improved downtown ratings, it records a less favorable assessment of cost of living: 60% excellent or good in 2020, compared with 47% in 2024.
The availability of affordable quality housing received 41% positive ratings in 2020 and 33% in 2024. The report identifies affordability as an area of concern. (2020 NCS report, PDF pp. 12 and 16; 2024 NCS report, printed pp. 12, 16 and 6; Q6 and Q7.)
The contrast gives this edition its central tension: more favorable assessments of some opportunities, less favorable assessments of affordability.
It does not tell us that downtown improvements made housing harder to afford. The separate totals do not even establish that the same respondents held both views. They show different evaluations of different parts of community life.
The housing figure also needs its full meaning. A 33% positive rating for affordable-quality-housing availability does not mean that only a third of residents could afford their own homes. Respondents were evaluating a community characteristic. The cost-of-living question likewise does not measure an inflation rate.
What the findings provide is a reason to look beyond a comfortable-looking community average. A hypothetical household income tells us little about the choices facing a particular person seeking a home, managing existing expenses, or considering a move. The fictional portrait cannot supply the missing budget or explanation.
Appreciation is not the same as affordability.
For further reporting, the most useful starting point would be a concrete decision: finding a place to live, staying in one, or helping someone else look. What options were available? What made the choice workable or difficult? Such accounts could illuminate the survey without being treated as a new statistical sample.
No resident needs to surrender appreciation for Hastings before describing an obstacle to living here. And no favorable citywide rating should be used as an answer to a question it never asked.
The findings a warm portrait should not leave out
The less favorable evaluations were not confined to housing.
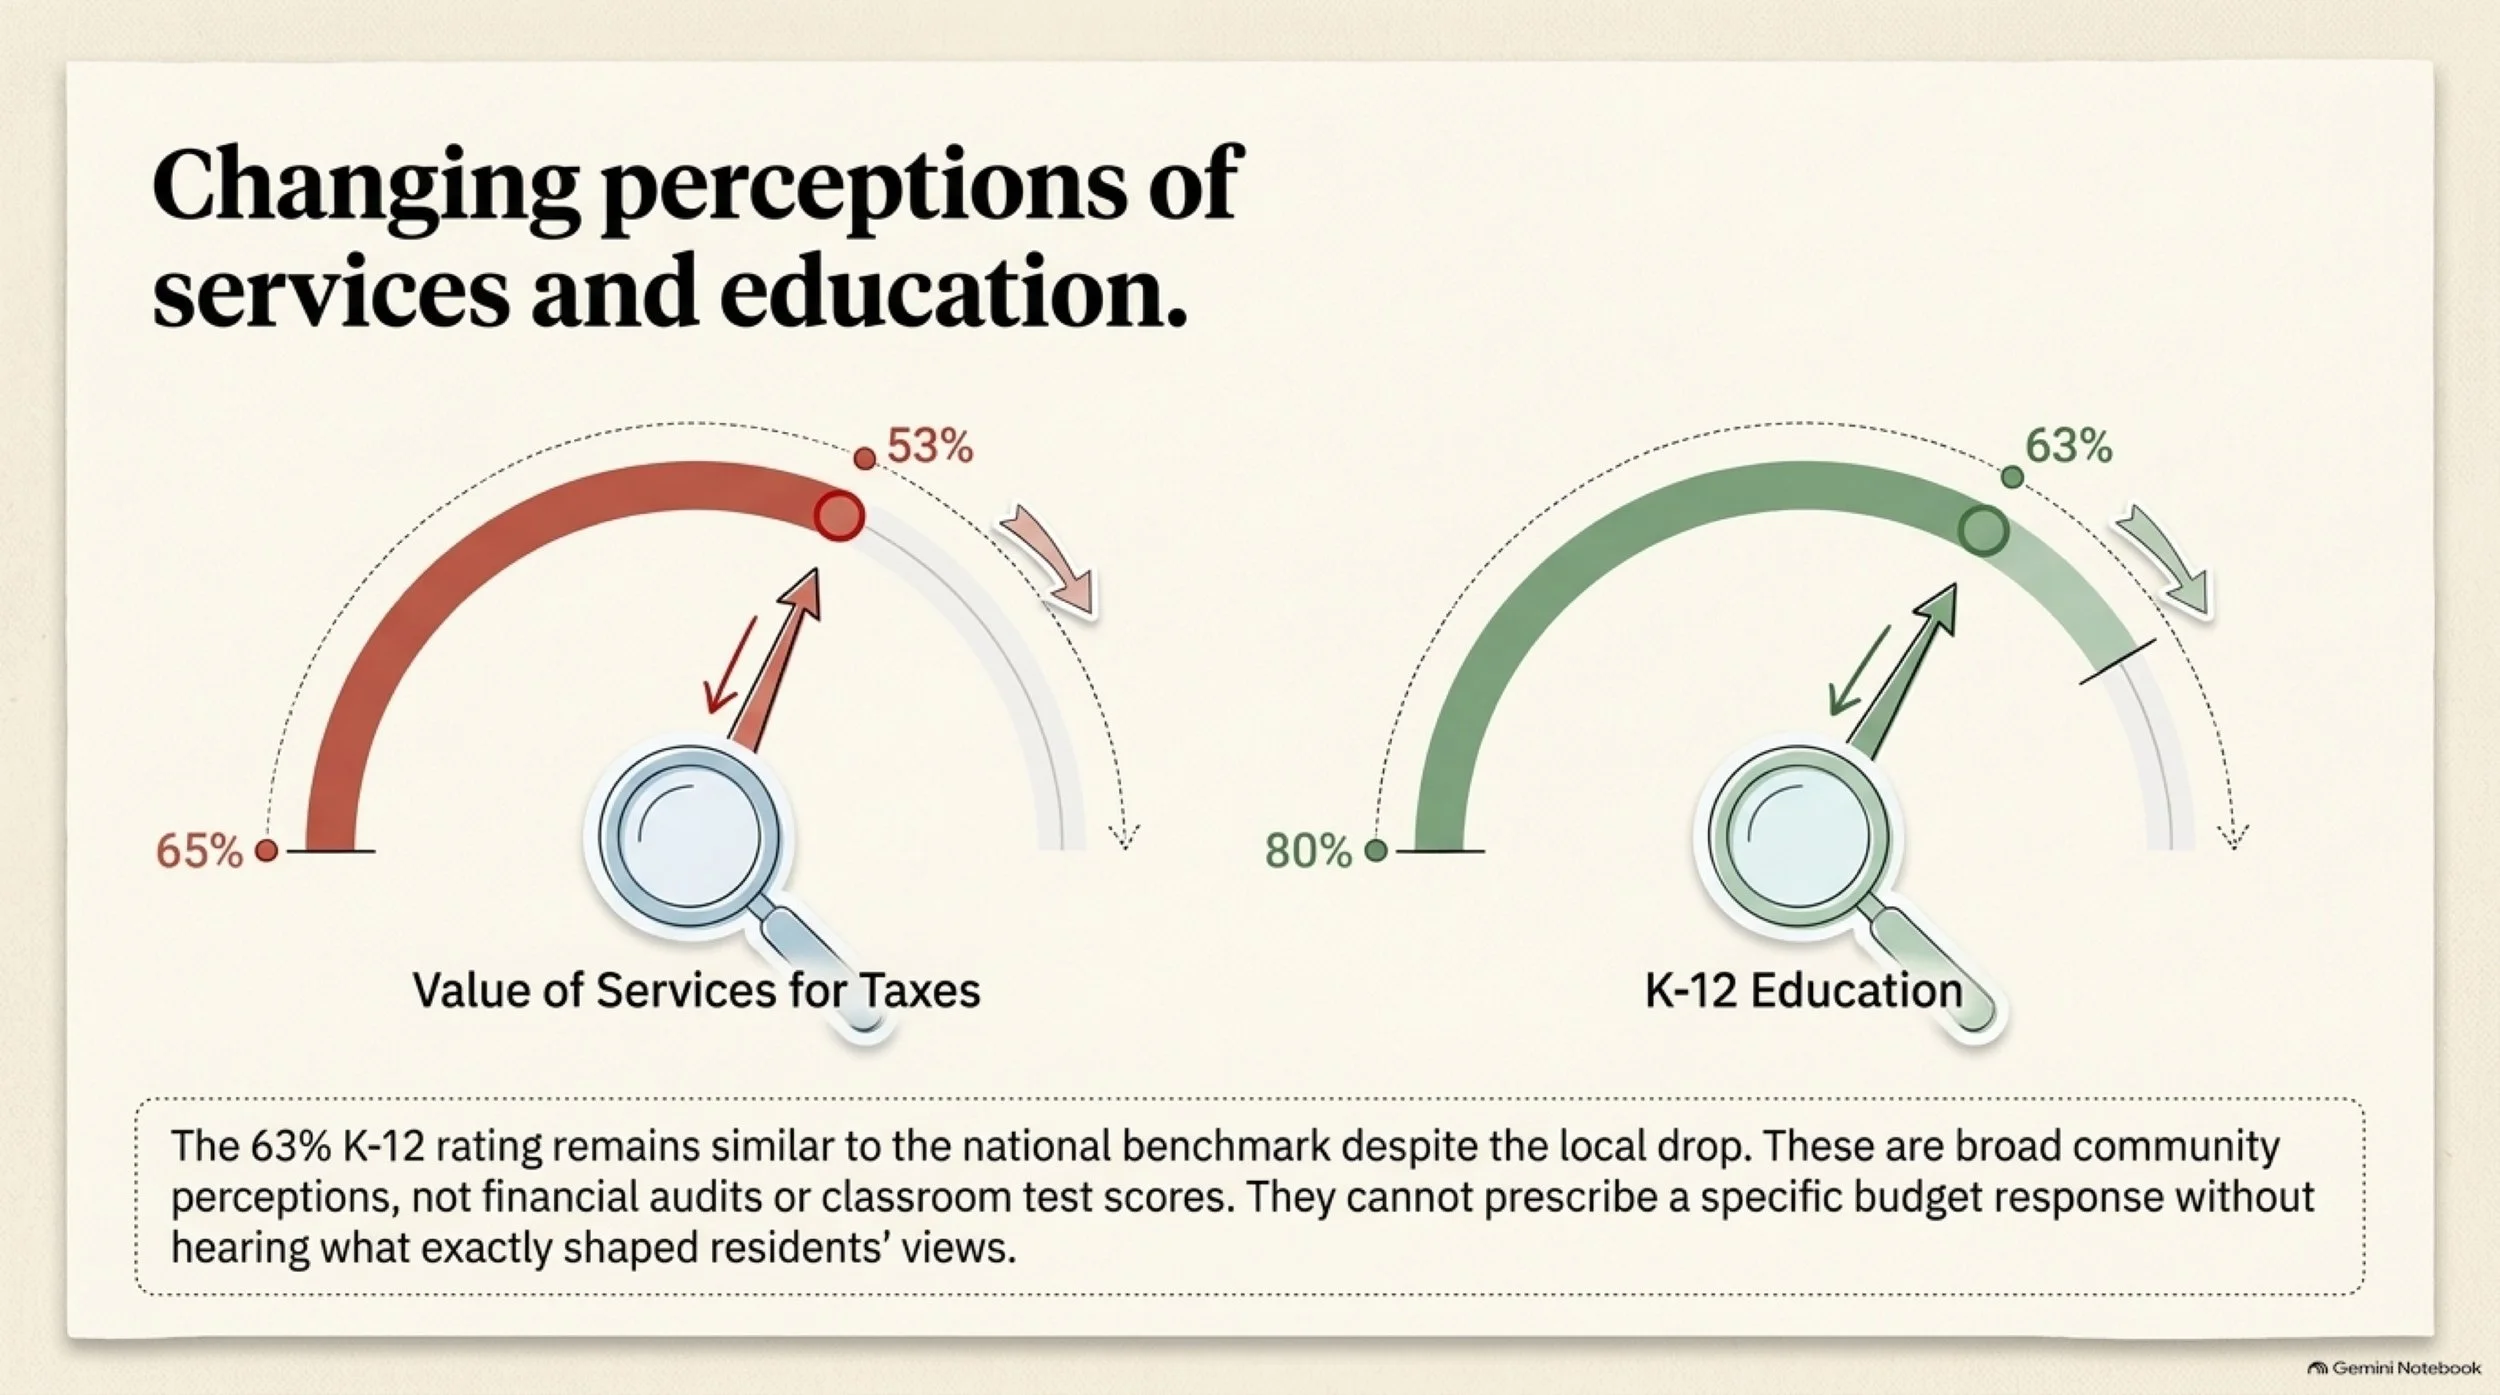
The excellent-or-good rating for the value of services for taxes paid to Hastings fell from 65% to 53%. This twelve-point decline concerns perceived value—not a financial audit, a finding of waste, or proof that a particular service deteriorated. (2020 NCS report, PDF p. 10; 2024 NCS report, printed p. 9; Q10.)
Taking that result seriously means being specific about the next question. Which services did people have in mind? What information would help them connect spending with the results they experience? The rating cannot identify the cause of dissatisfaction or prescribe a budget response.
K–12 education received 80% positive ratings in 2020 and 63% in 2024. The report highlighted the seventeen-point decline while classifying the 2024 result as similar to its national benchmark. A local decline and a similar national comparison can both be true. (2020 NCS report, PDF p. 24; 2024 NCS report, printed pp. 23 and 6; Q7.)
This was a community evaluation, not a test score, classroom observation, or parents-only survey result. Explaining it requires hearing what shaped respondents’ assessments and examining appropriate educational evidence. It does not justify a conclusion about individual teachers, students, or schools.
The City, school district, service providers, businesses, and community organizations should not be collapsed into a single actor responsible for every finding. Nor should the composite become a shortcut for guessing what any official intends.
The point is to ask clearer questions about the place we share. An encouraging portrait that cannot accommodate difficult findings would not be a very useful one.
A good walking route does not answer every journey
The favorable trail result also belongs beside another transportation finding.
Ease of travel by public transportation received 10% positive ratings in 2020 and 19% in 2024. The displayed increase exceeds seven points, but the 2024 rating remained below Polco’s national benchmark. This was a community assessment, not a survey limited to regular transit riders. (2020 NCS report, PDF p. 14; 2024 NCS report, printed p. 13; Q7.)
Here again, an improved evaluation can remain low. And a strong result for one way of moving through Hastings cannot answer every transportation need.
Consider the difference between choosing a pleasant route and needing to reach a destination at a particular time. To understand the second, we would need to know about the actual trip: its starting point, destination, timing, and available options.
Those details are not contained in the citywide rating. They are precisely the kind of knowledge a resident can contribute without having to speak for everyone who travels the same way.
An invitation is not yet a connection
The surveys’ participation findings are especially useful when their questions stay separate.
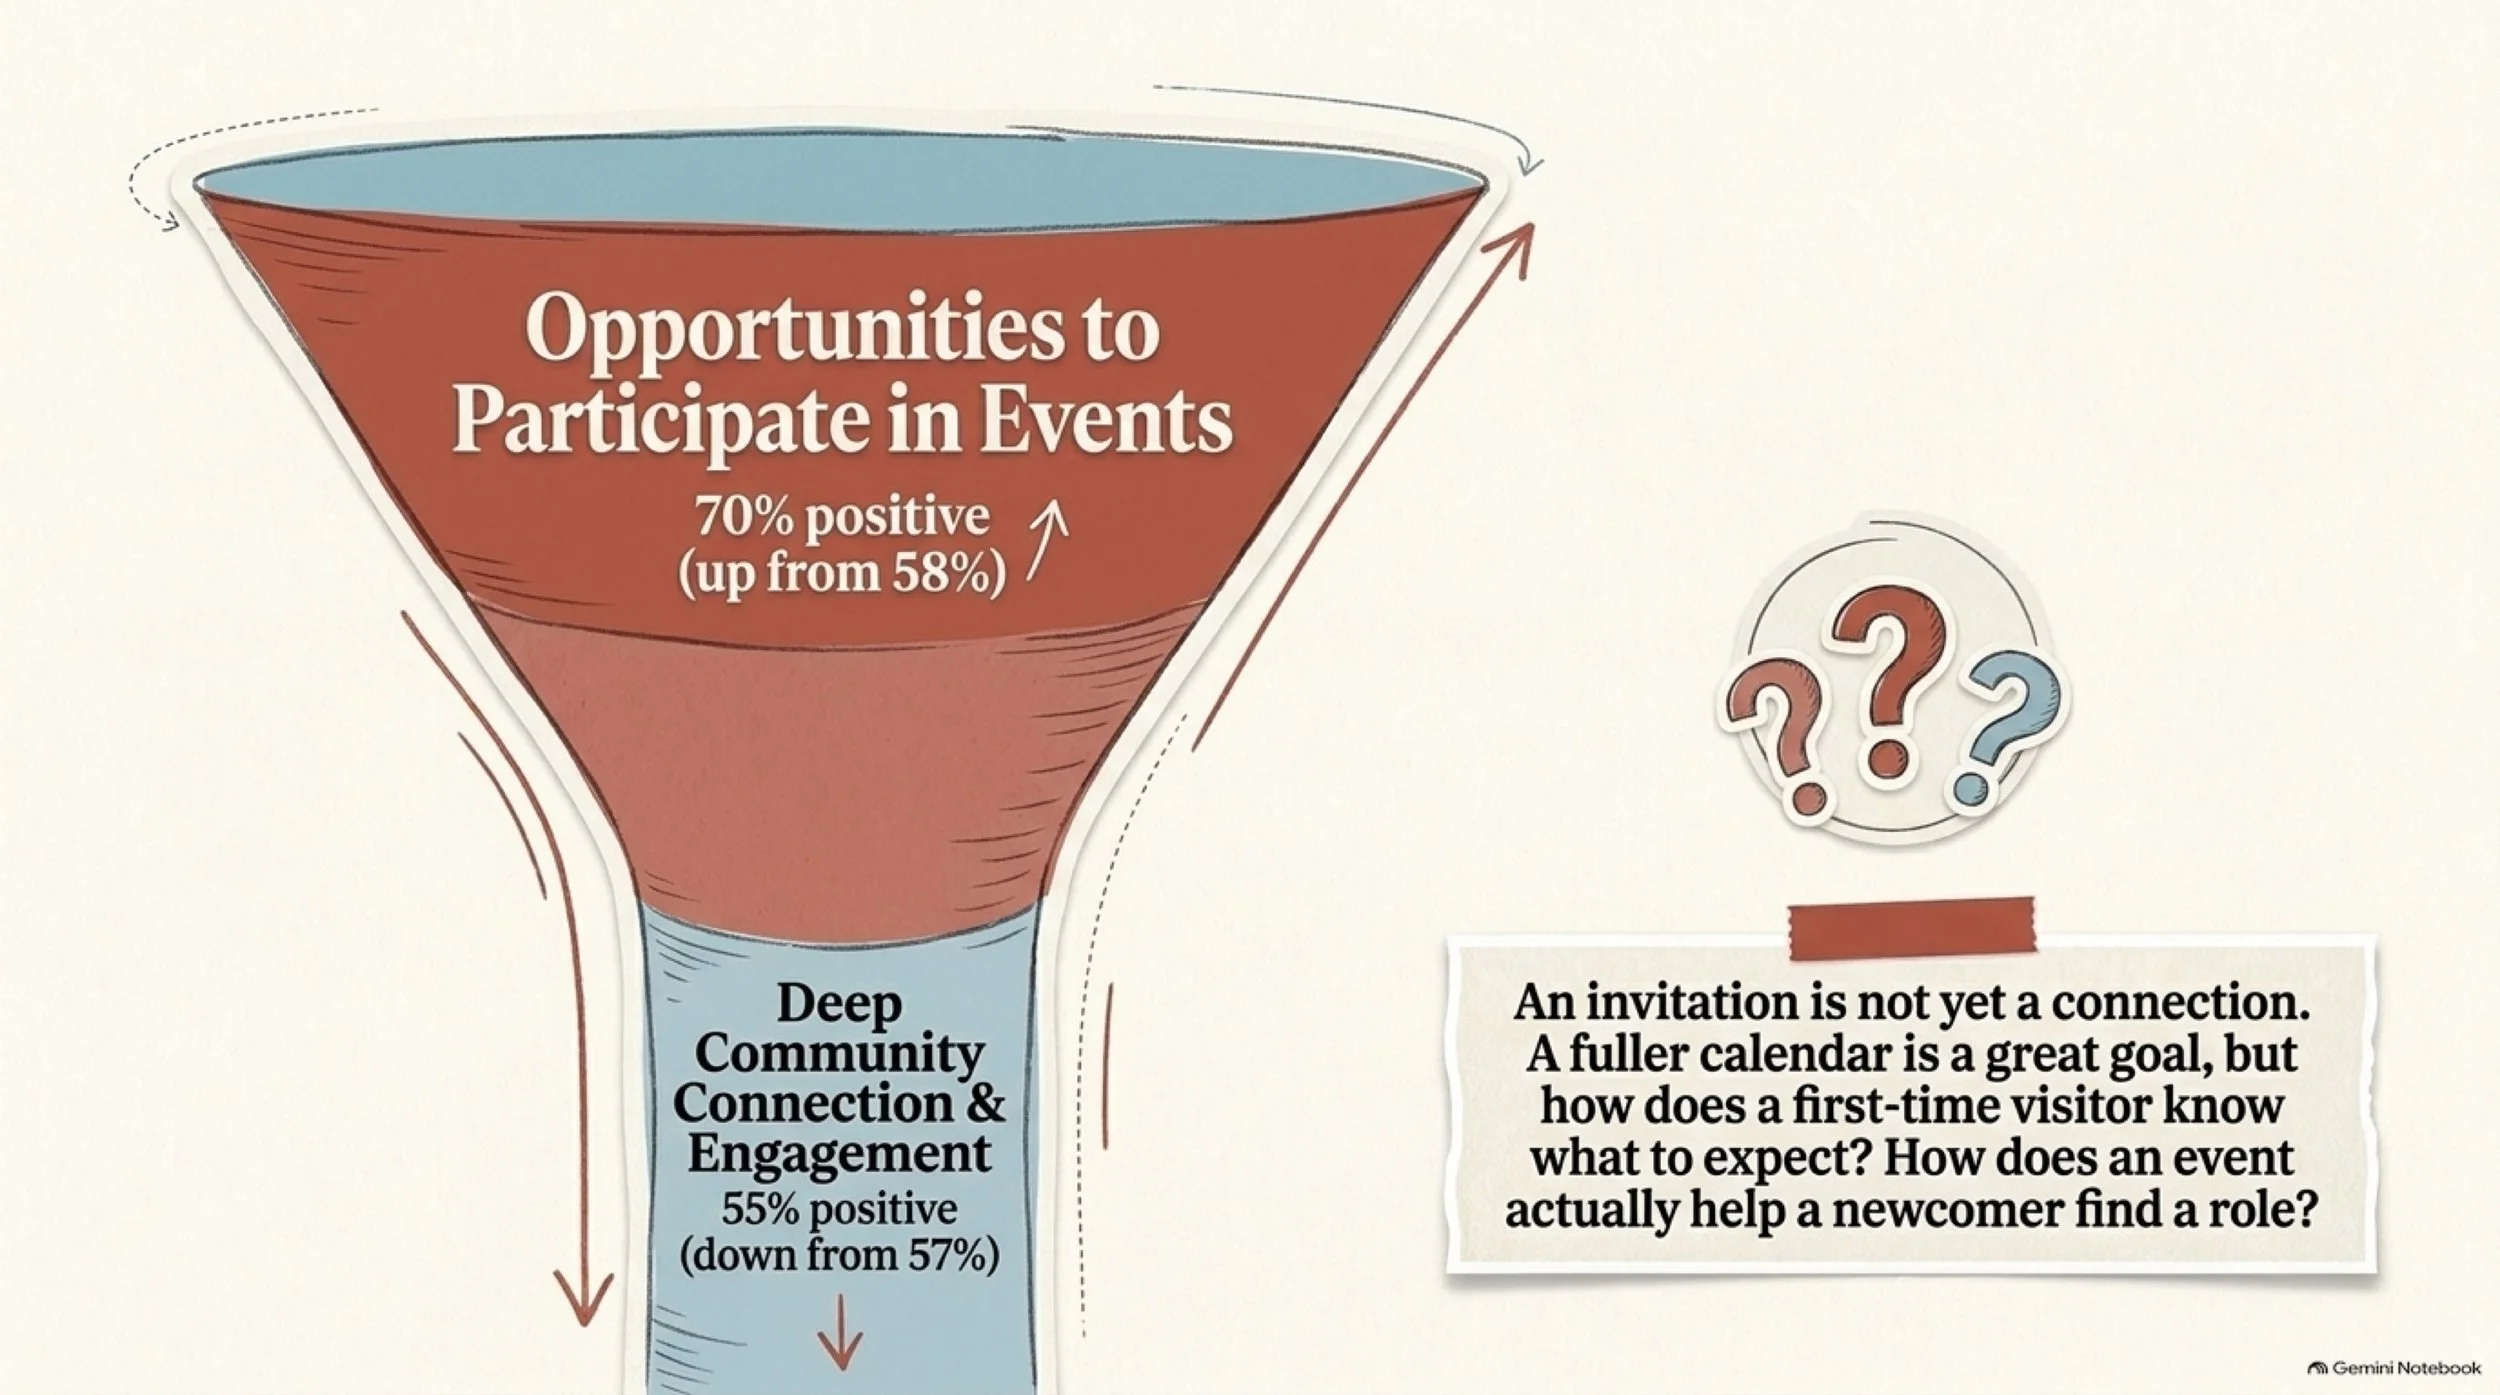
Opportunities to participate in social events and activities rose from 58% positive ratings in 2020 to 70% in 2024. That is not the special-events-and-festivals question, which reached 76%. (2020 NCS report, PDF p. 26; 2024 NCS report, printed pp. 26 and 23; Q7.)
A different item—residents’ connection and engagement with their community—received 57% positive ratings in 2020 and 55% in 2024, a small difference below the report’s change threshold. Respondents evaluated Hastings as a whole; they were not asked whether they personally felt connected. (2020 NCS report, PDF p. 25; 2024 NCS report, printed p. 25; Q2.)
It would therefore be wrong to say that only 55% of residents felt they belonged, or to subtract these percentages and count a group of disconnected people.
The distinction still opens a worthwhile conversation. What helps an opportunity become a connection?
For someone organizing an activity, that might mean asking how a first-time visitor knows what to expect. For a community group, it might mean examining how a newcomer finds a role. For a resident, it could begin with remembering what made returning easier.
Those are possible lines of inquiry, not explanations established by the survey. They shift attention from whether something exists to how someone experiences it.
A fuller calendar and a stronger sense of connection are different goals. A community can keep working on both.
Leave room for people who are not posting
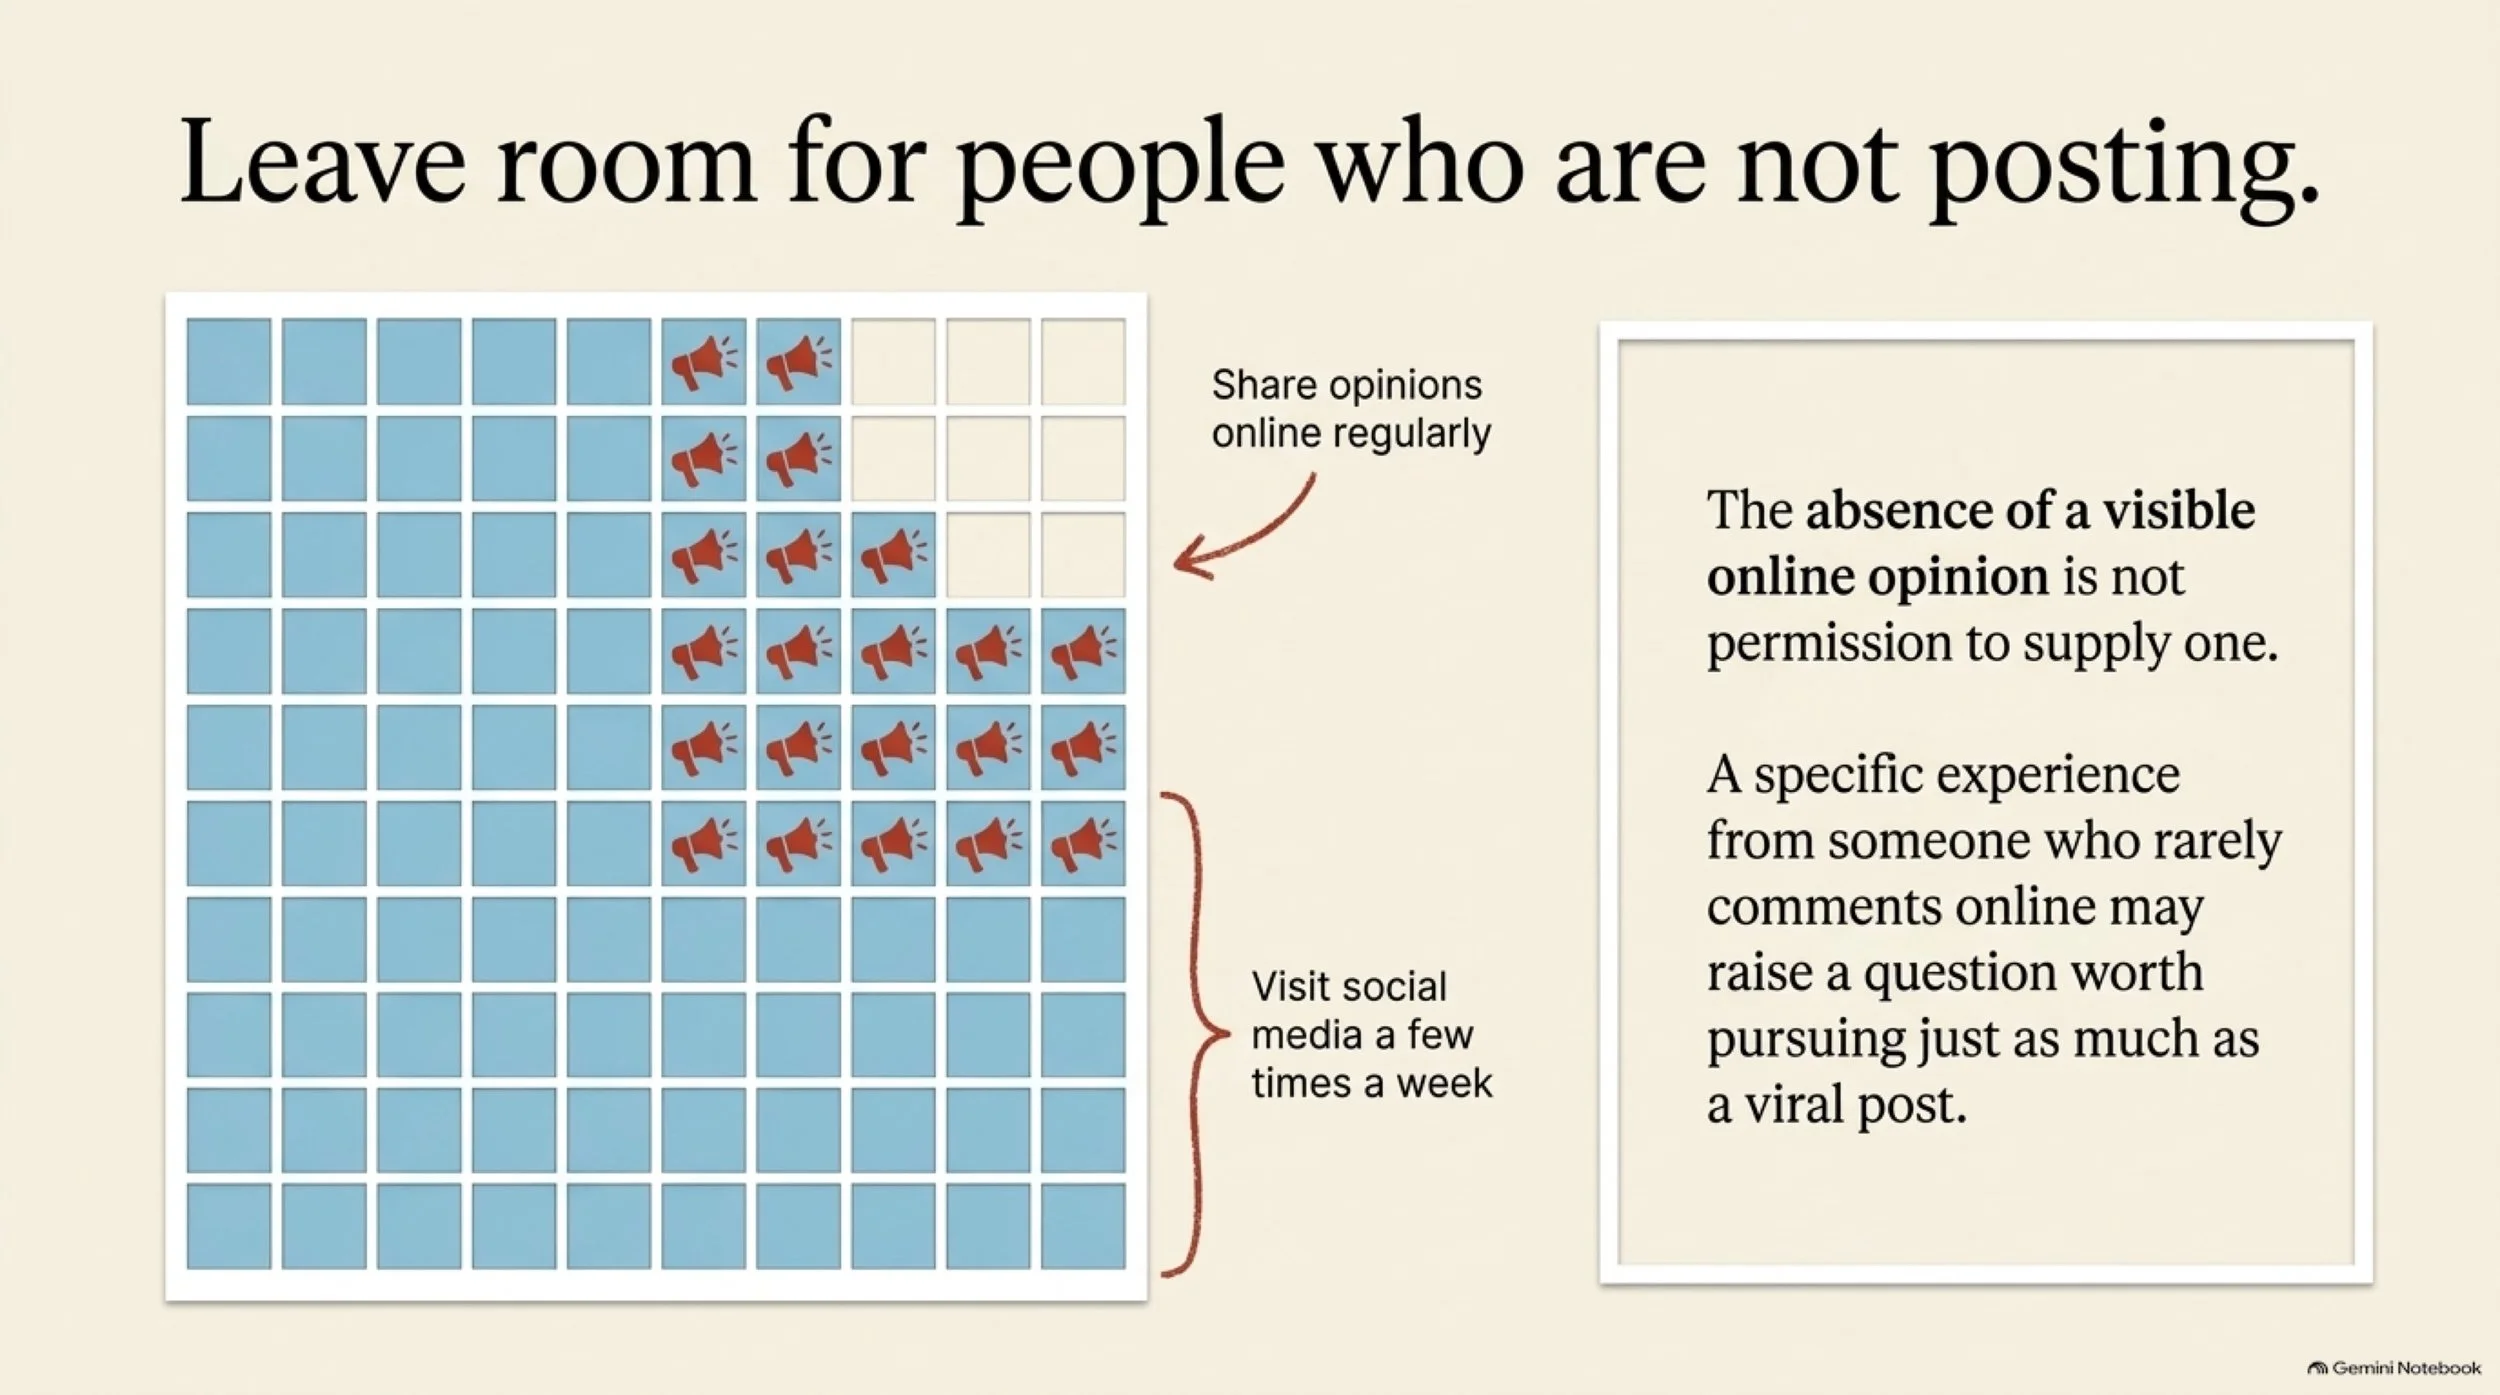
In 2024, 81% reported visiting social-media sites a few times a week or more, while 23% reported sharing their opinions online that often. The corresponding 2020 figures were 76% and 25%. These measure general online behavior, not local-news readership or civic knowledge; the platform examples also changed between questionnaires. (2020 NCS report, PDF p. 27; 2024 NCS report, printed p. 27; D1.)
These results do not reveal what less frequent posters think. That is the point: an absence of visible opinion is not permission to supply one.
For this series, the editorial lesson is to look beyond the most noticeable reactions. A specific experience from someone who rarely comments may raise a question worth pursuing. A popular comment may do the same. Neither becomes representative because it is memorable.
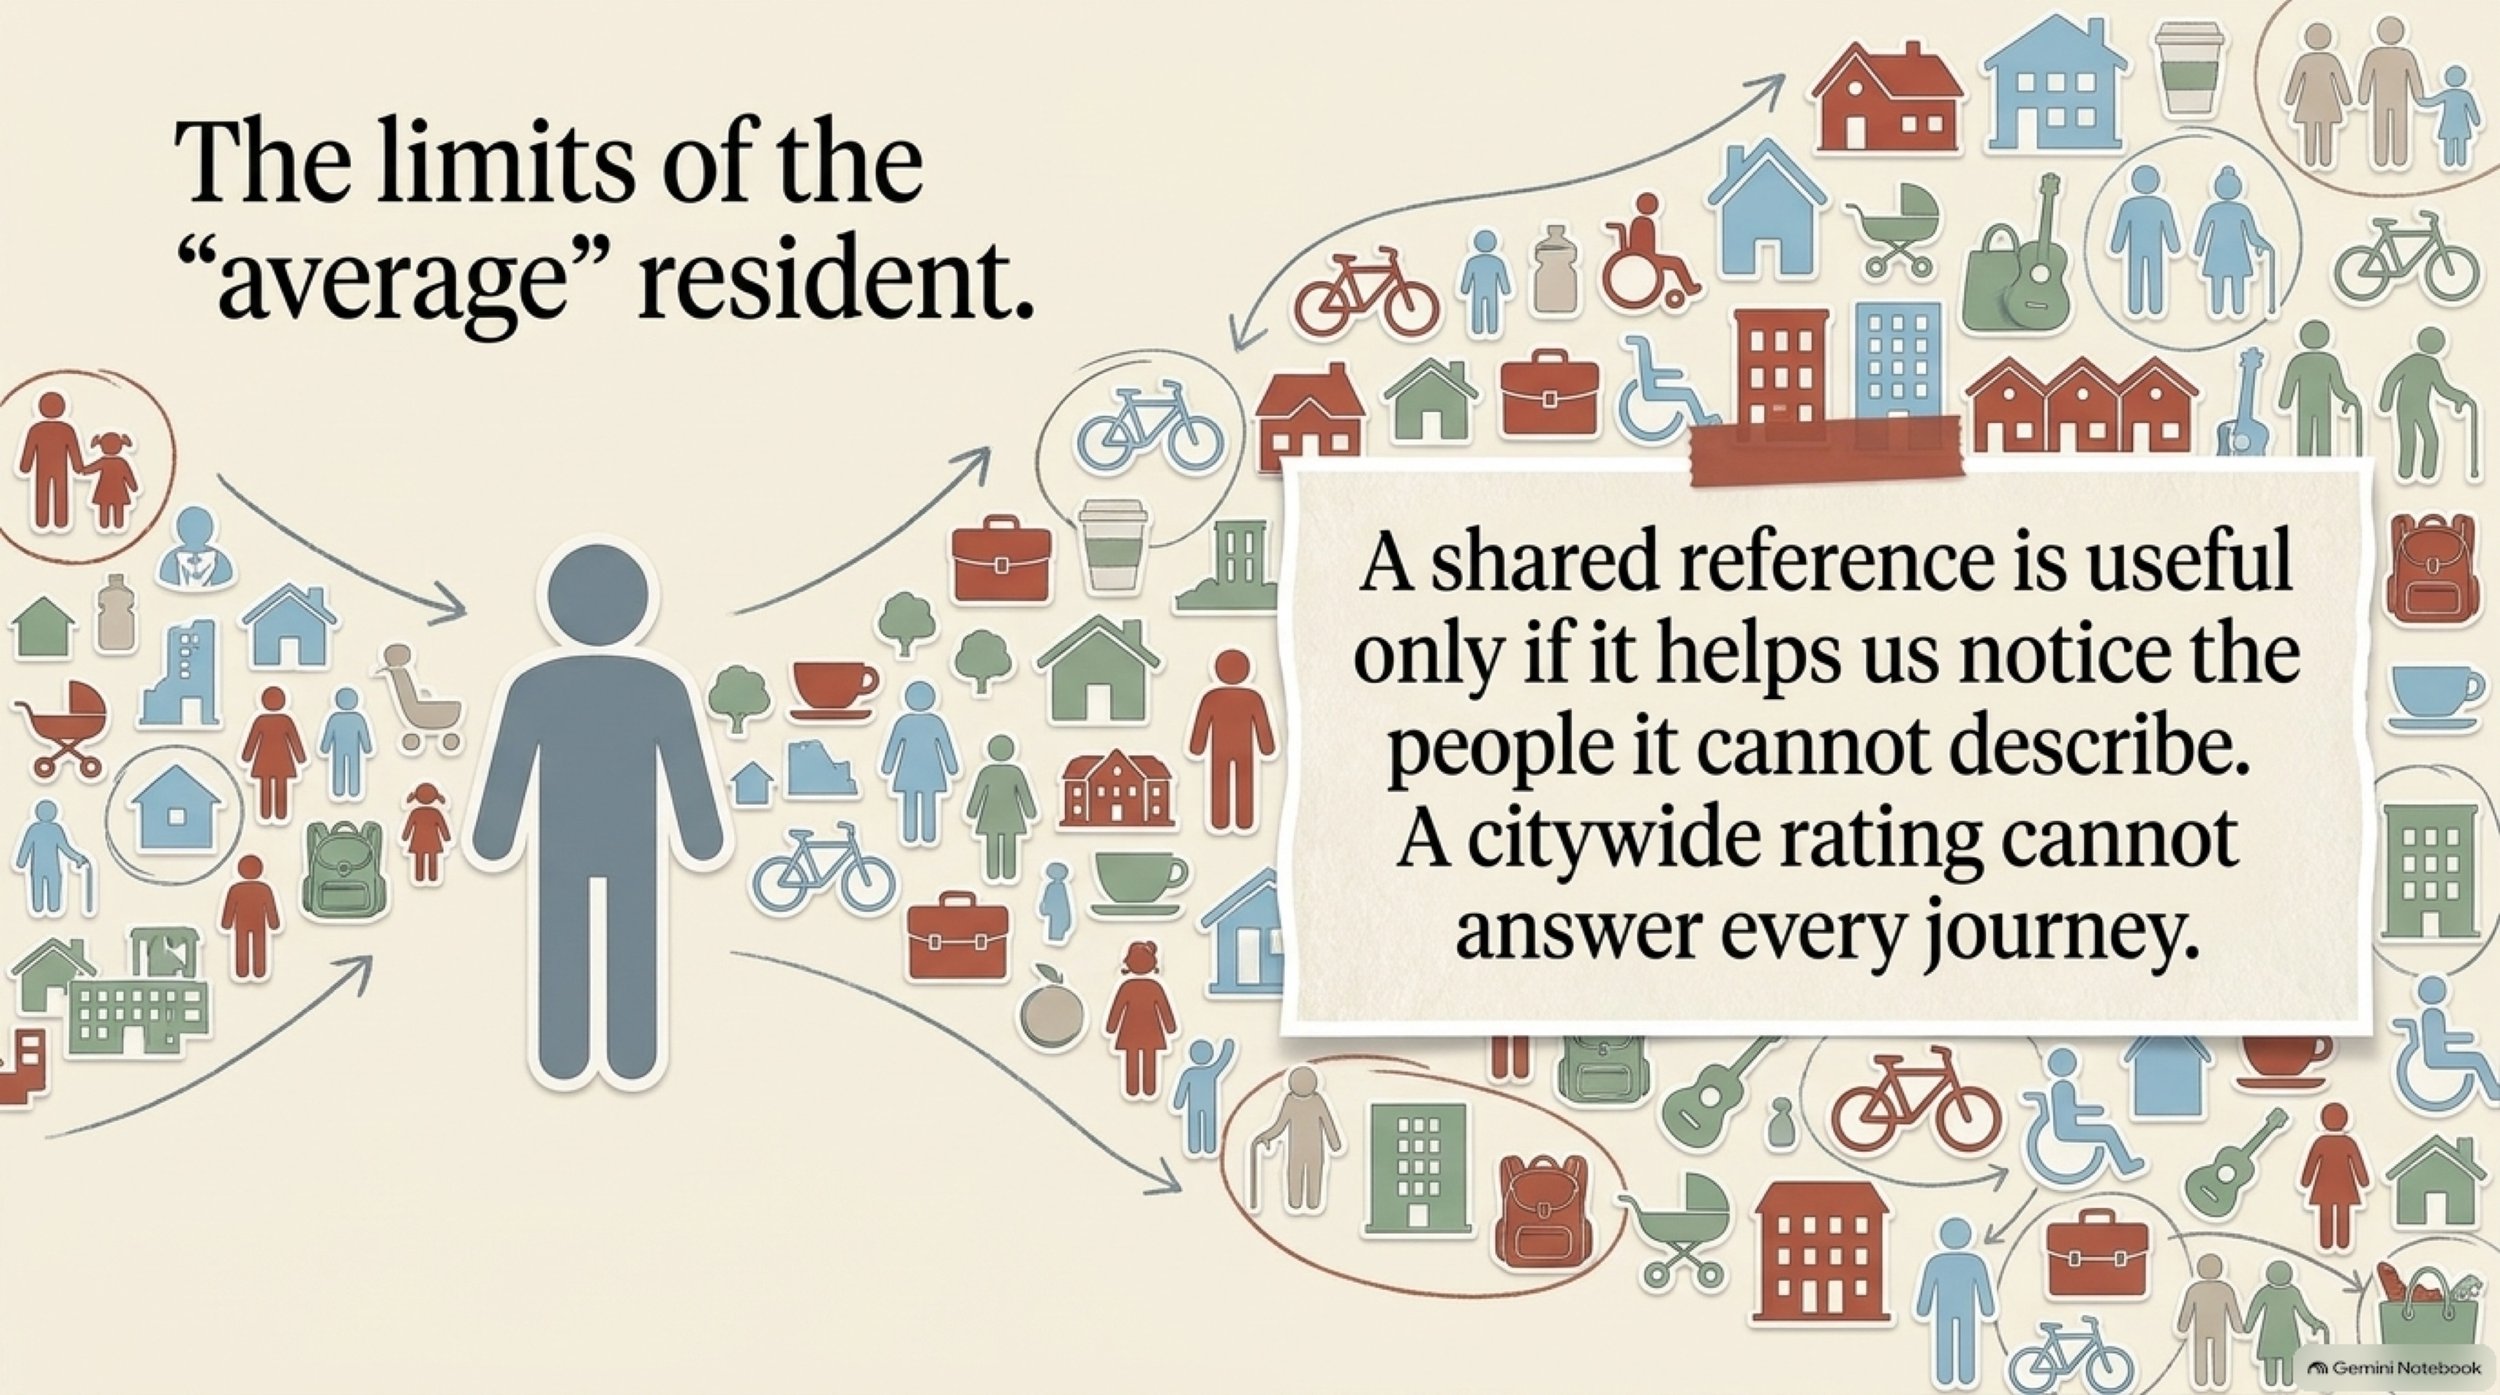
The purpose of a community reference is not to sort people into those who fit and those who do not. Someone who resembles the portrait may have a very different experience from someone who resembles it just as closely. Someone unlike the figure may know something essential about a service, a route, or a barrier.
A shared reference is useful only if it helps us notice the people it cannot describe.
About the surveys
This analysis uses National Research Center at Polco’s The National Community Survey: Hastings, MN—Report of Results, for 2020 and 2024, supplied by the City. Providing the reports does not imply City endorsement of this article.
The 2020 survey collected 367 responses, October 1–November 29, with a 19% response rate. The 2024 survey collected 479 responses, March 4–April 8, with a 13% response rate. Household addresses were randomly selected within city boundaries; an adult was selected using a birthday instruction. Results were weighted toward adult population characteristics. These were separate samples, not an established panel following the same individuals. (2020 report, PDF pp. 2–4; 2024 report, printed pp. 1, 3–5.)
Percentages here exclude separate open-participation responses and exclude “don’t know” answers from the displayed ratings. They are not percentages of every resident. The overall sample sizes are not the response counts for every question. (2020 report, PDF p. 3; 2024 report, printed pp. 3–5.)
The reports give 95% sampling margins of up to ±5 percentage points in 2020 and ±4.5 in 2024 for all-respondent results. The 2024 report calls differences greater than seven points statistically significant. Both reports state that no adjustments were made for design effects; sampling margins do not cover every source of error, including nonresponse. Wording changes can also affect comparisons. The source appendix records the individual questions and limitations. (2020 report, PDF p. 3; 2024 report, printed pp. 2–5.)
AI assisted the source comparison and writing. This is a document-based feature, not a report of new interviews or an independent statistical replication.
What the mirror cannot tell us
The surveys give us a record of favorable assessments, changing evaluations, and questions that deserve attention. They do not give the fictional figure a voice. They give actual residents a reason to add theirs.
Our aim with the Living Portrait is to make that relationship useful: show a community-wide pattern, explain its limits, and make room for experiences the pattern cannot capture.
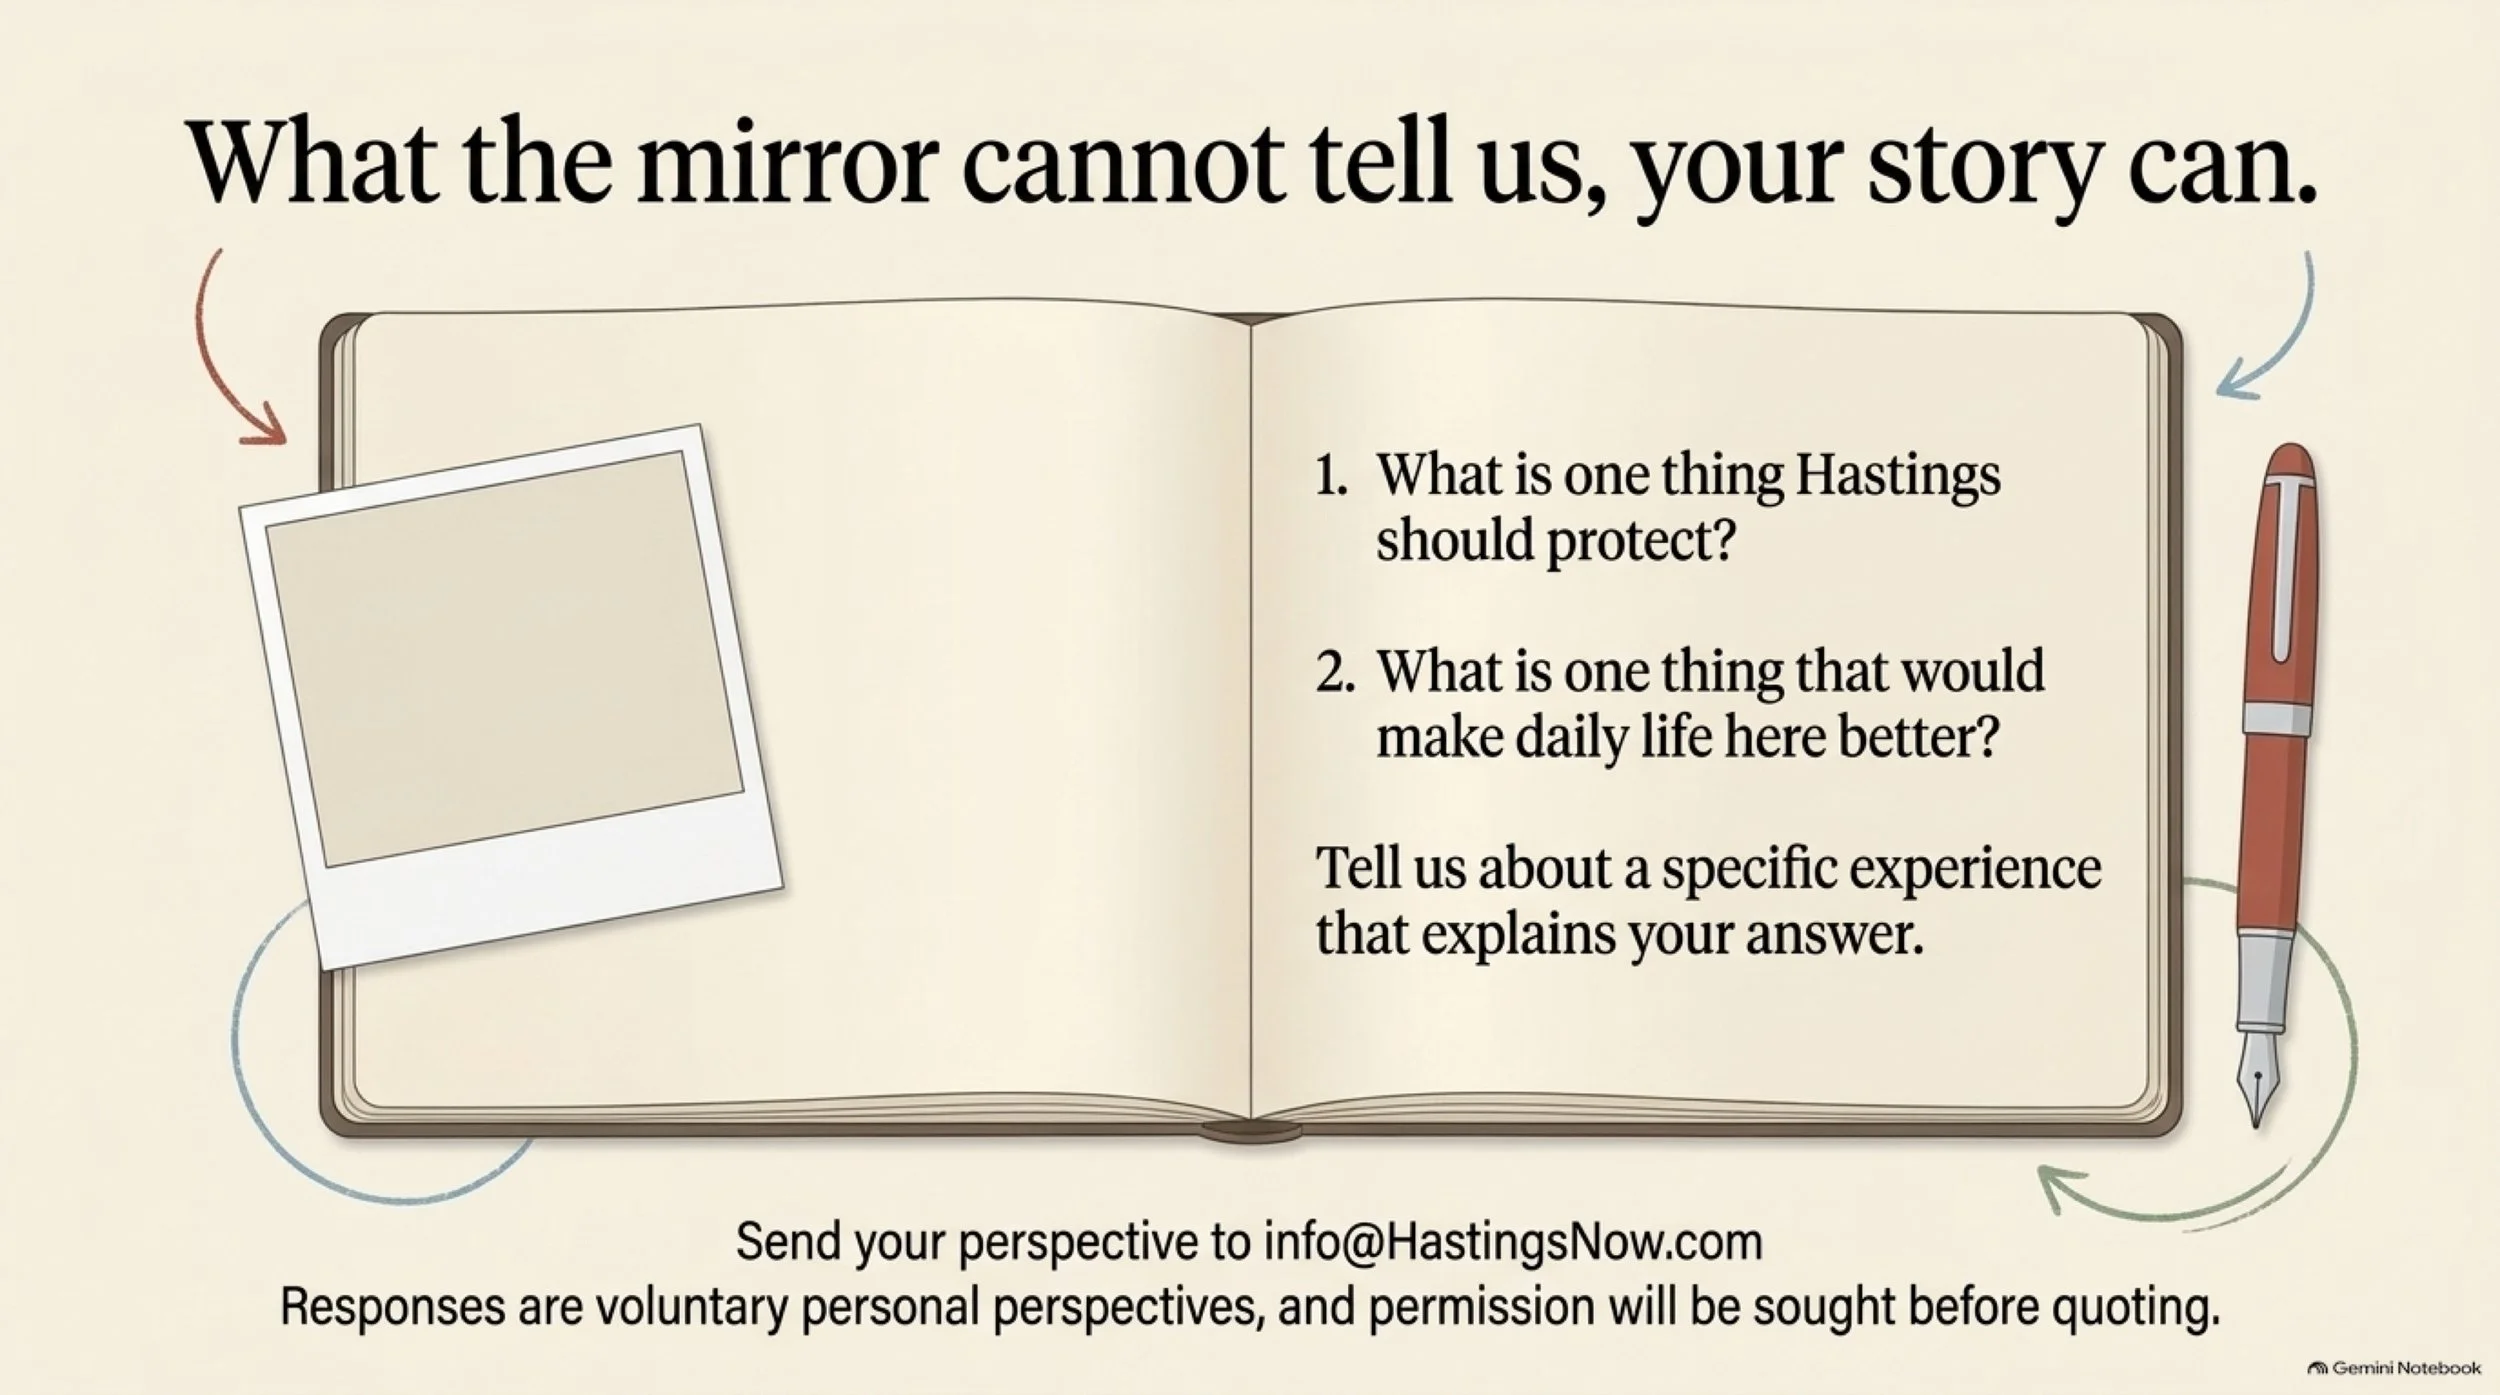
Think back to the two questions at the beginning. What would you miss? What would make your week easier?
Choose a specific experience that helps explain an answer. You do not need to represent an age group, a neighborhood, or everyone with the same housing situation. You do not need to agree with the survey. And you do not need to disclose income, an exact address, beliefs, or identifying details about children.
Send a response or correction to info@HastingsNow.com, the address on our contact page. Please say whether we may contact you.
Responses are voluntary personal perspectives, not a representative poll or automatic changes to the statistics. We will seek permission before identifying or quoting contributors, as described in Part One.
What is one thing Hastings should protect—and one thing that would make daily life here better? Tell us about an experience that explains your answer.